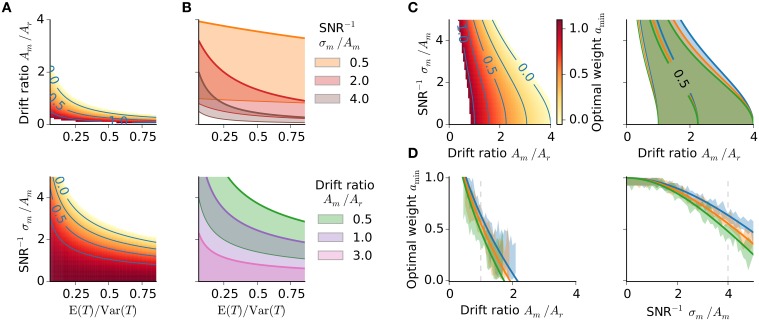
Figure 4.
Optimality characteristics. (A,B) Optimal weight amin in dependence on the stimulus distribution. (A) Optimal weight amin with SNR−1 fixed to 4 (upper panel) and drift ratio of 1 (lower panel), respectively. Same color bar as in (C, left). (B) Regions of amin ∈ (0, 1] for three different SNR−1 and drift ratios, respectively; thick colored lines amin = 0, thin colored lines amin = 1. (C) Optimal memory weight amin as a function of drift ratio and inverse signal-to-noise ratio. Left: Optimal weight amin for the stimulus range 494 − 847 ms. Right: Regions of amin ∈ (0, 1] for each stimulus range from Figure 1. Colors as in Figure 1. (D) Optimal weight amin as a function of the drift ratio and inverse SNR, respectively, for all three stimulus ranges from Figure 1. Again an inverse SNR of 4 and a drift ratio of 1, respectively, have been used. Gray dashed lines mark those values. Simulation data (1000 runs per stimulus) confirm the theoretical prediction (shaded areas of same color, 10% percentile for minimal MSEs).

