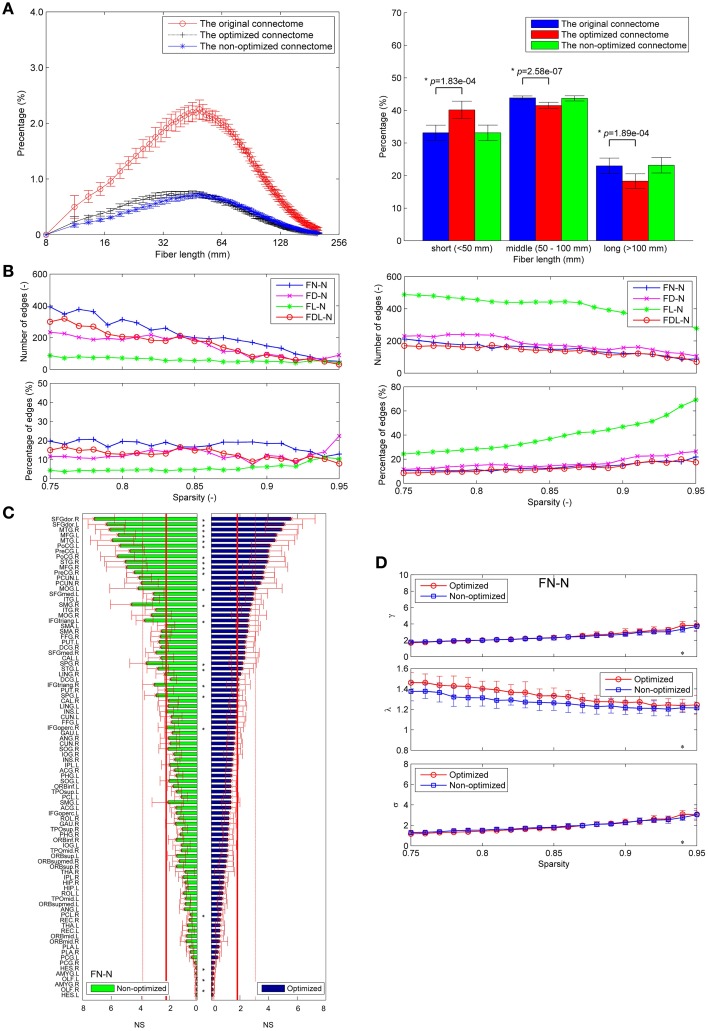
Figure 10.
Application to HCP dataset. (A) The fiber length distributions of the original connectome, the optimized connectome with LiFE and the non-optimized connectome without LiFE. (B) The differences between the edges of the optimized and non-optimized networks weighted by various methods in the sparsity range of 0.75–0.95. Left column indicates the number and percentage of significantly different edges as a function of sparsity. Right column indicates the number and percentage of false positive edges as a function of sparsity. (C) Differences of the node strength (NS) between the optimized and non-optimized networks weighted by the fiber number (FN-N). (D) Comparison the global network measures between the optimized and non-optimized networks (the normalized mean characteristic path length, the normalized mean clustering coefficient, and the small-worldness) for the networks weighted by the fiber number (FN-N).

