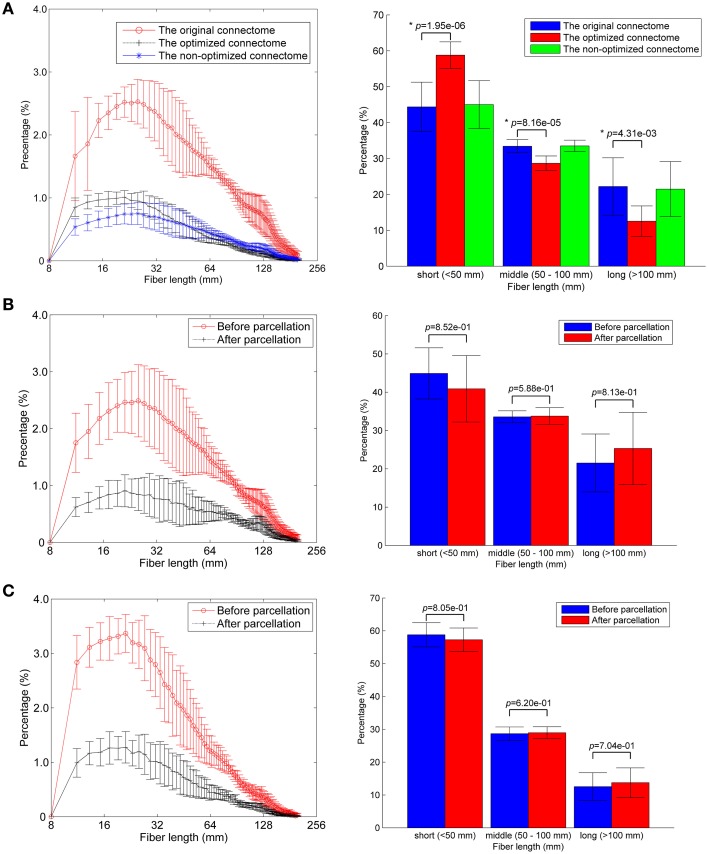
Figure 2.
Fiber length distributions. (A) The fiber length distributions of the original connectome, the optimized connectome with LiFE, and the non-optimized connectome without LiFE. Left column is the histogram where the mean and standard deviation are plotted for nine healthy subjects. Right column indicates the percentages of short, middle, and long fibers. (B) The fiber length distribution of the non-optimized connectome before and after parcellation. (C) The fiber length distribution of the optimized connectome before and after parcellation.

