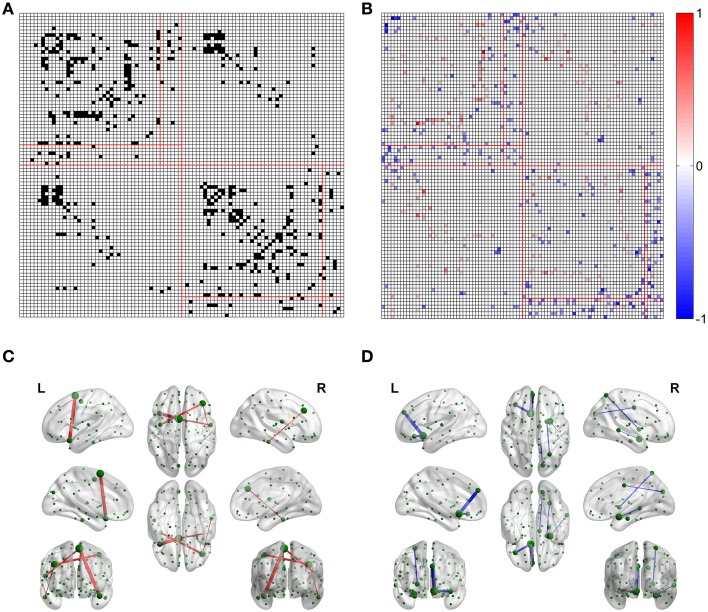
Figure 4.
Differences between the edges of the optimized and non-optimized networks weighted by the fiber number (FN-N). (A) The difference between the weighted edges in the optimized and non-optimized networks at a sparsity of 0.75 (The edges with significant difference (p < 0.01) are shown in black). (B) False positive edges and possible missing edges at a sparsity of 0.75. The legend at right shows the normalized weights, and the colors of red and blue indicate the false positive edges and possible missing edges, respectively. (C) The false positive edges (Top 5). (D) The possible missing edges (Top 5).

