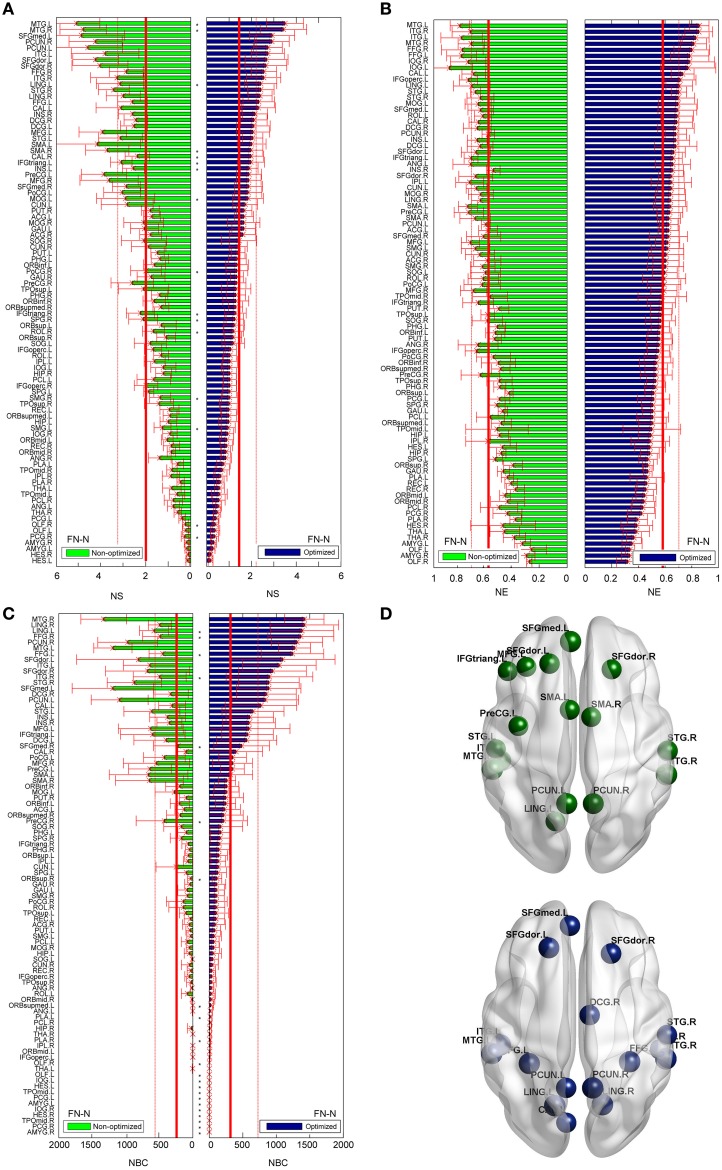
Figure 7.
Differences of the nodal measures between the optimized and non-optimized networks weighted by the fiber number (FN-N). Here* indicates there is a significantly difference between the measures from the non-optimized network and the optimized network (p < 0.05). The nodes are ordered according to the nodal measures of the optimized network. The vertical thin and bold lines indicate the mean and mean + SD of the measures of all nodes. (A) The node strength (NS). (B) The node efficiency (NE). (C) The node betweenness centrality (NBC). (D) The nodes with high NBC (>mean + SD; The first row is for the non-optimized network and the second row is for the optimized network).

