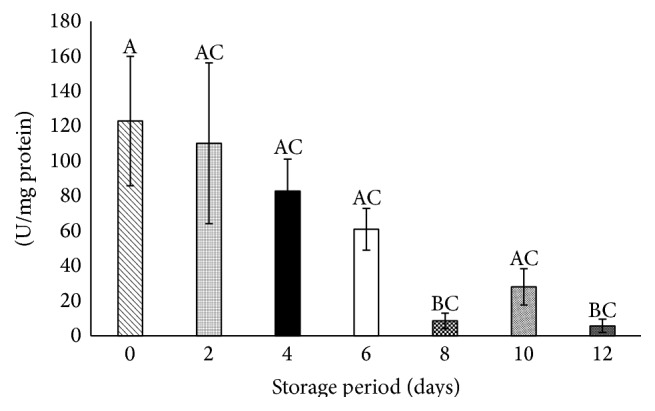
Figure 4.

Catalase in stored platelets. Values are mean ± SE of five animals/group. One-way ANOVA was performed between the groups followed by Tukey-Kramer multiple comparison test, using Graph Pad Prism 6 software, and represented in upper case at P < 0.05. Those not sharing the same letters are significantly different.
