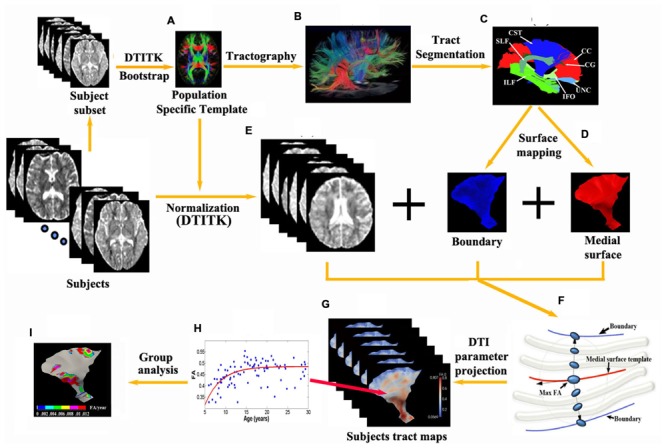
FIGURE 1.

Flowchart of the tract-specific analysis includes procedures and diagram of medial geometry. (A,E) A deformable DTI registration algorithm, DTI-TK, is used in which image similarity is computed based on full tensor images. All subjects are aligned to a population specific template. 13 major tracts (C) and their corresponding medial surfaces (D) are manually segmented and extracted from the brain tractography of the template (B). (F) The red curve represents the medial surface (skeleton) of the corticospinal tract. The boundaries (purple edges) are derived from the skeleton and radial field by inverse skeletonization. The vector (black arrow) lies in the tangent plane of the medial surface, and points in the direction of greatest changes in radius. DTI measurement (e.g., max FA) along the radius within the boundaries is then projected on to the individual subject’s tract map in the template space (G) and can be further analyzed per vertex such as exponential fits versus age over a population, etc. (H) yielding parametric maps [e.g., Δ(FA)/year in I].
