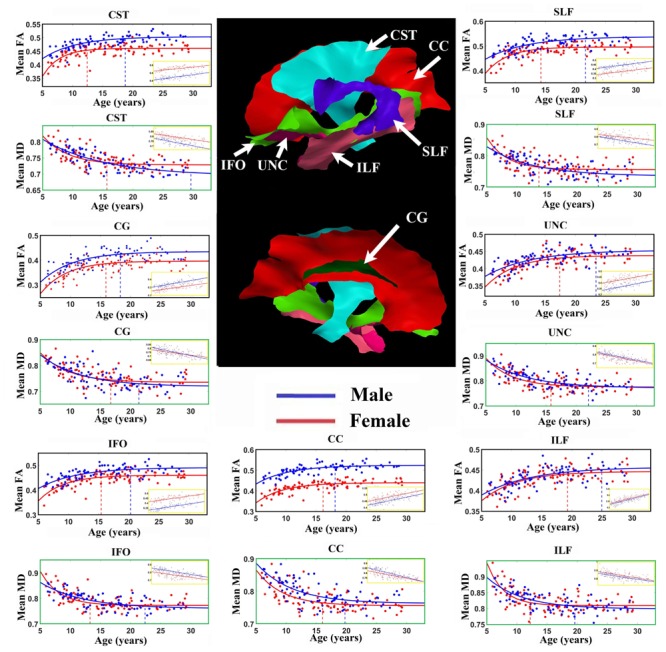
FIGURE 2.

Age-related FA increases and MD (units of 10-3 mm2/s) decreases averaged over all vertices with either exponential or linear fits (insets) of each tract in males (blue lines) and females (red lines). Middle: Tract surfaces derived from the template are shown, but recall that only a proportion of these vertices contribute to these exponential curves and linear fit (as in Tables 1 and 2). Maximum FA and minimum MD plateau of each tract for both female (red) and male (blue) are marked by the vertical dotted lines. Projection and inter-hemispheric tracts such as CST and CC tend to reach the FA plateau earlier than temporal lobe association tracts such as SLF, UNC, and ILF. Generally, males have higher FA over the full age span for the exponential whereas it is quite similar for MD. There are differences in the fit parameters presented in Tables 1 and 2. CST, Corticospinal tract; CC, corpus callosum; CG, cingulum; IFO, inferior fronto-occipital fasciculus; ILF, inferior longitudinal fasciculus; SLF, superior longitudinal fasciculus; UNC, uncinate fasciculus.
