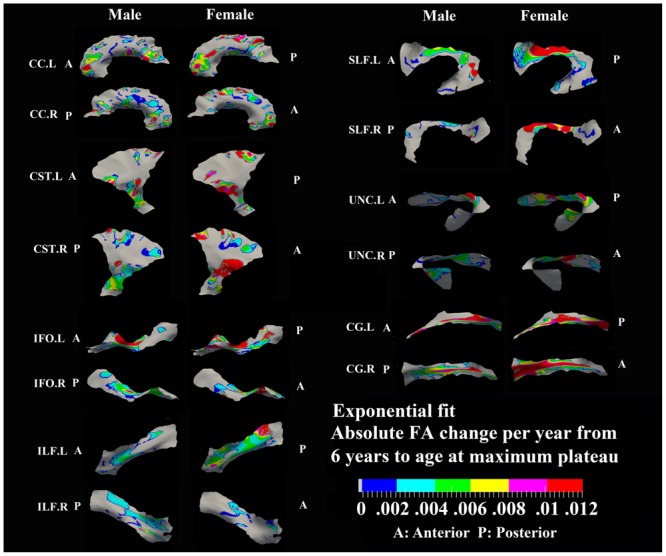
FIGURE 3.

Areas with significant exponential increase of FA and their absolute change per year from age 6 years to age where FA plateaus at its maximum value in 13 tracts. Here, the plateau is defined as 90% of FA of the asymptote of the exponential curve from 6 to 30 years. Faster FA changes were observed in genu of CC, fronto-parietal part of SLF and inferior CST relative to the other areas of the tracts. Smaller tracts such as left ILF, IFO, and CG displayed faster changes in the posterior part of the tracts, though more pronounced in females. Gray regions are those vertices that are either better fitted with a linear model or have no significant correlation with age.
