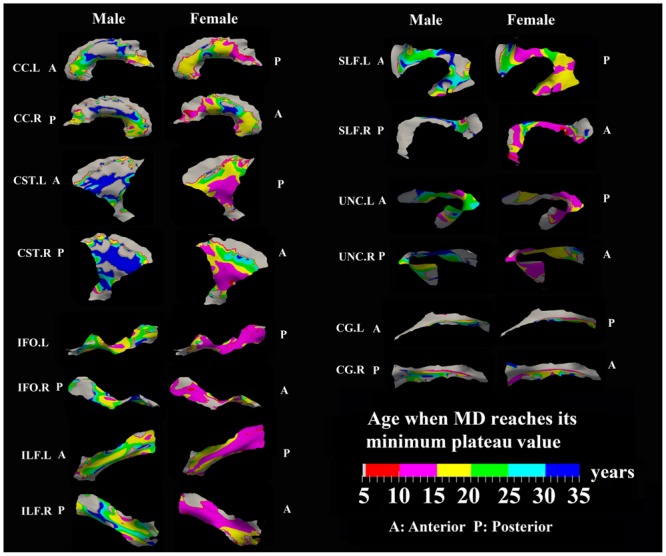
FIGURE 7.

Areas with significant exponential decrease of MD and the age needed to reach the minimum plateau value in 13 tracts. Most tracts in females reach their minimum MD before age 15 years while males reach their minimum values after this age. Gray regions are those vertices that are either better fitted with a linear model or have no significant correlation with age.
