
FIGURE 9.
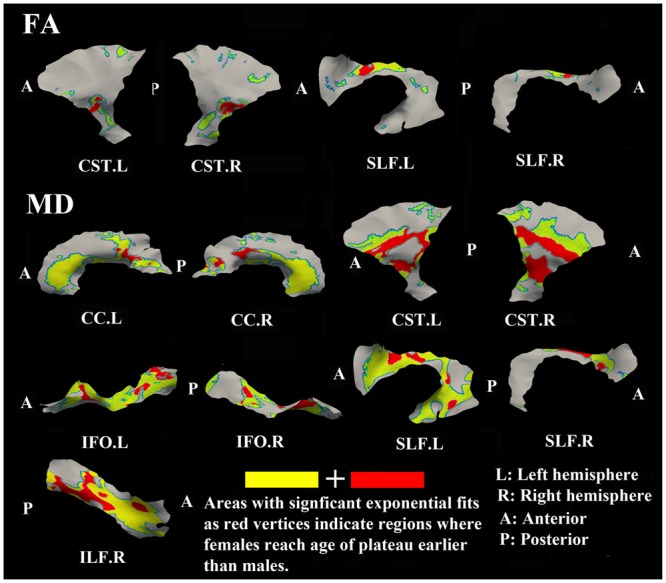
Areas of tracts that display significant exponential fits in both males and females (yellow and red) where red indicates female age of plateau + 1 SE < male age of plateau – 1 SE (age differences between sexes that were greater than one standard error from their exponential fits are considered to be significantly different); note that the reverse pattern (males with earlier diffusion changes than females) was not observed for any vertex. Females demonstrate earlier plateau age in the bilateral inferior CST and bilateral fronto-parietal part of SLF for FA and MD, and in the splenium of CC, bilateral IFO, and right ILF for MD. Tracts with no significant difference between the age of FA or MD plateau in males and females at the vertex level are not shown.