
Figure 13.
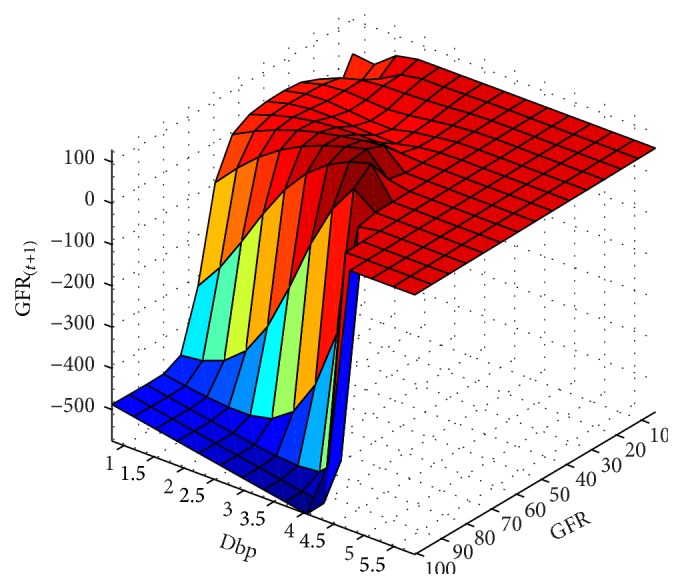
GFR(t+1) function and its relationship with the dbp and gfr variables for the 6-month period.
Official websites use .gov
A
.gov website belongs to an official
government organization in the United States.
Secure .gov websites use HTTPS
A lock (
) or https:// means you've safely
connected to the .gov website. Share sensitive
information only on official, secure websites.
GFR(t+1) function and its relationship with the dbp and gfr variables for the 6-month period.