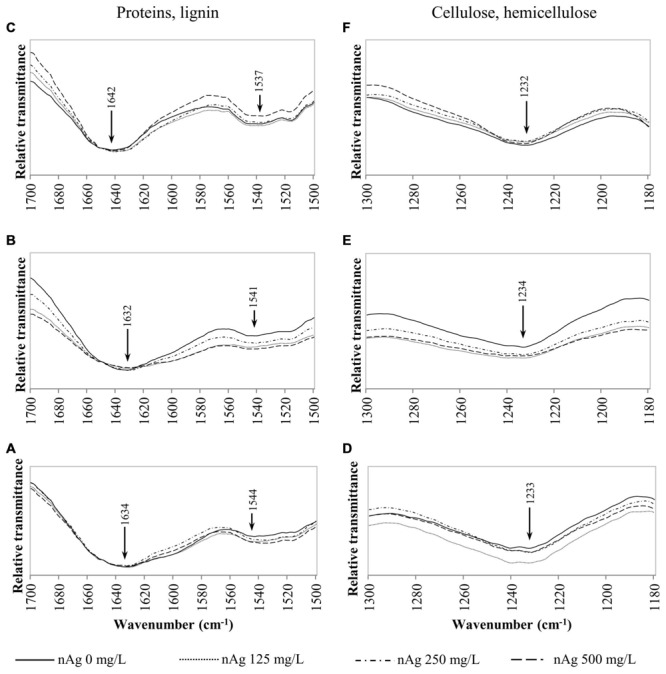
FIGURE 4.

Overlap ATR-FTIR spectra of radish sprouts exposed to nAg at 0, 125, 250, and 500 mg/L. Spectral region associated with proteins and lignin in seedlings’ roots (A), stems (B), and leaves (C); and regions related to cellulose and hemicellulose in sprouts’ roots (D), stems (E) and leaves (F).
