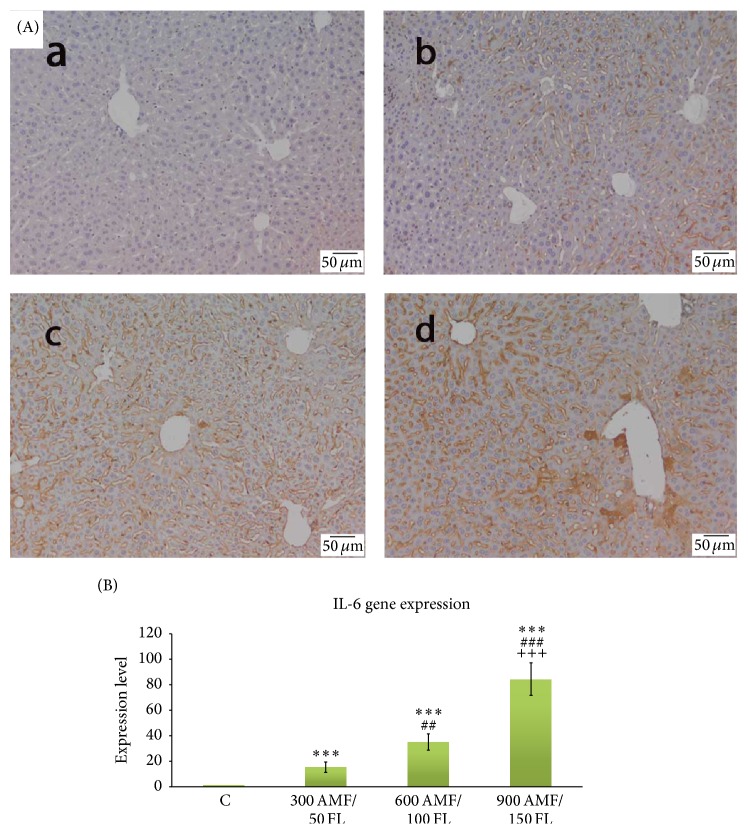
Figure 2.
The effect of flucytosine and amphotericin B coadministration on the gene expression and specific hepatic distribution of IL-6. (A): (a) control group; (b) 50 mg/kg flucytosine + 300 μg/kg amphotericin B group; (c) 100 mg/kg flucytosine + 600 μg/kg amphotericin B group; (d) 150 mg/kg flucytosine + 900 μg/kg amphotericin B group; (B) real-time PCR was used to investigate mRNA levels of IL-6 target genes. Significance levels are marked as follows: ∗∗∗ P < 0.001 compared with control, ##<0.01 and ### P < 0.001 compared with 300 AMF/50 FL group, and +++ P < 0.001 compared with 600 AMF/50 FL group.

