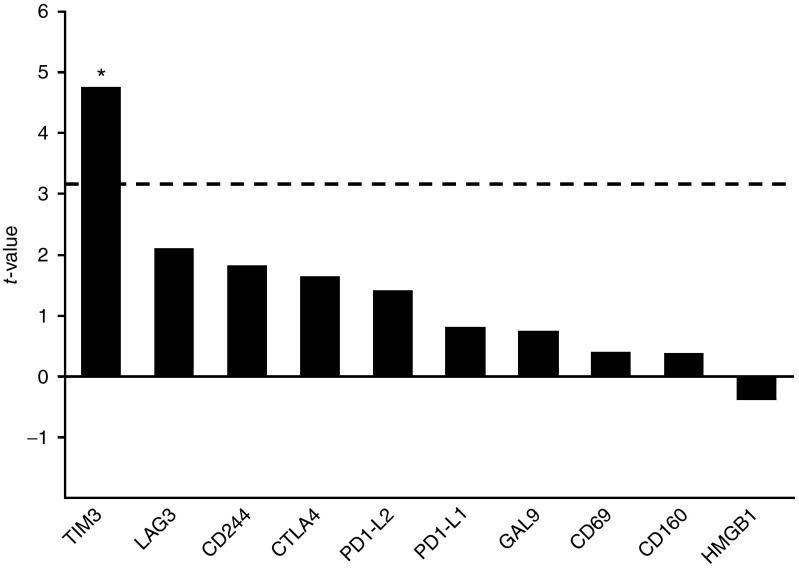
Figure 4.
Graphical presentation of genes associated with T-cell exhaustion. Positive t-value indicates upregulation in deltaOS-negative patients compared to deltaOS-positive patients, whereas negative value indicates upregulation in positive deltaOS group. Dashed line indicates threshold for significant t-value. Upregulation of TIM-3 in deltaOS-negative patients was significant (P = 0.006). *P < 0.05

