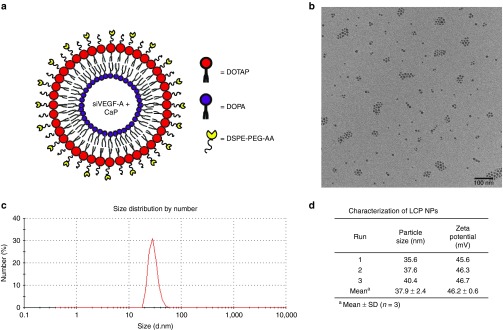
Figure 1.
Characterization of LCP NPs. (a) Illustration of asymmetric bilayer. (b) TEM photomicrograph of LCP NPs loaded with siVEGF-A, Bar = 100 nm. (c) Size distribution of LCP NPs loaded with siVEGF-A. (d) Average LCP NPs particle size and zeta potential of LCP NPs loaded with siVEGF-A with AA. Data shown as mean ± SD (n = 3).

