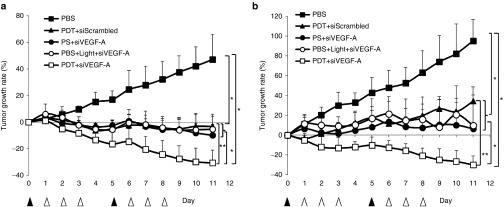
Figure 3.
Tumor growth curves of HNSCC xenograft models. (a) Tumor growth rate of treated SCC4 xenograft. (b) Tumor growth rate of treated SAS xenograft. ▴ indicates i.v. injection of PBS and photosan with or without light. Δ indicates i.v. injection of targeted LCP with either siScrambled or siVEGF-A and PBS for control group. Data present as mean ± SD, n = 5. *P < 0.01 compared to PBS group; **P < 0.01 compared to PDT +siScrambled group. PBS, phosphate buffered saline; PDT, photodynamic therapy; PS, photosan; siScrambled, scrambled siRNA; siVEGF-A, VEGF-A siRNA.

