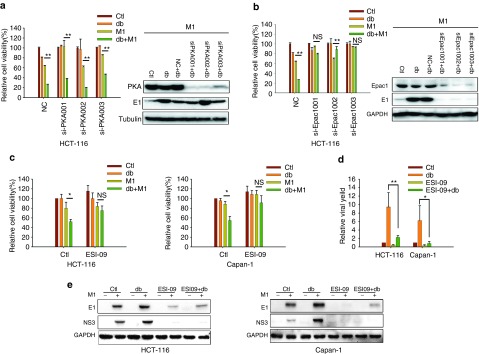
Figure 5.
Epac1 is the downstream effector of cAMP. (a and b) The effects of PKA and Epac1. HCT-116 cells were transfected with small interfering RNAs (siRNAs) against PKA or Epac1 and infected with or without M1 (10 plaque forming unit (PFU)/cell) in the presence or absence of db-cAMP. Cell viabilities were determined by MTT assay (left) (mean ± SD). PKAcα (a, right) and Epac1 (b, right) expression levels were determined. (c) The effect of Epac1 inhibitor treatment in cancer cells (mean ± SD). HCT-116 and Capan-1 cells were pretreated with ESI-09 (10 μmol/l) for 1 hour and then infected with M1 (10 PFU/cell) in the presence or absence of 400 μmol/l db-cAMP for 72 hours. (d and e) Viral production after Epac1 inhibitor treatment (mean ± SD). All four groups were infected with M1 (0.1 PFU/cell) (d). NC, negative control (scrambled siRNA). *P < 0.05; **P < 0.01; NS, not significant; GAPDH, glyceraldehyde-3-phosphate dehydrogenase.

