
FIGURE 2.
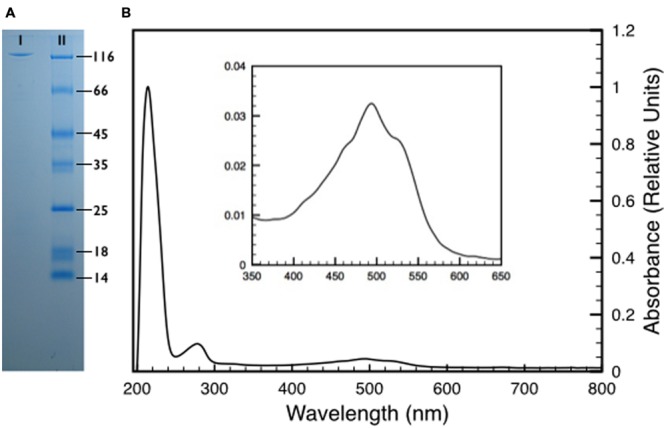
(A) Sodium Dodecyl SulphateSulfate-Polyacrylamide Gel Electrophoresis (SDS-PAGE) of a pure DR_2577 sample (I) compared to a molecular marker (II). The apparent weight of the DR_2577 band is consistent with its theoretical mass (123.7 kDa) when compared with the first band of the molecular marker (116 kDa). (B) Absorption spectrum of a pure DR_2577 sample in buffer. In the inset is shown a detail of the characteristic carotenoids-absorption bands in the region of the spectrum between 400 and 600 nm. See also Supplementary Figure S1.