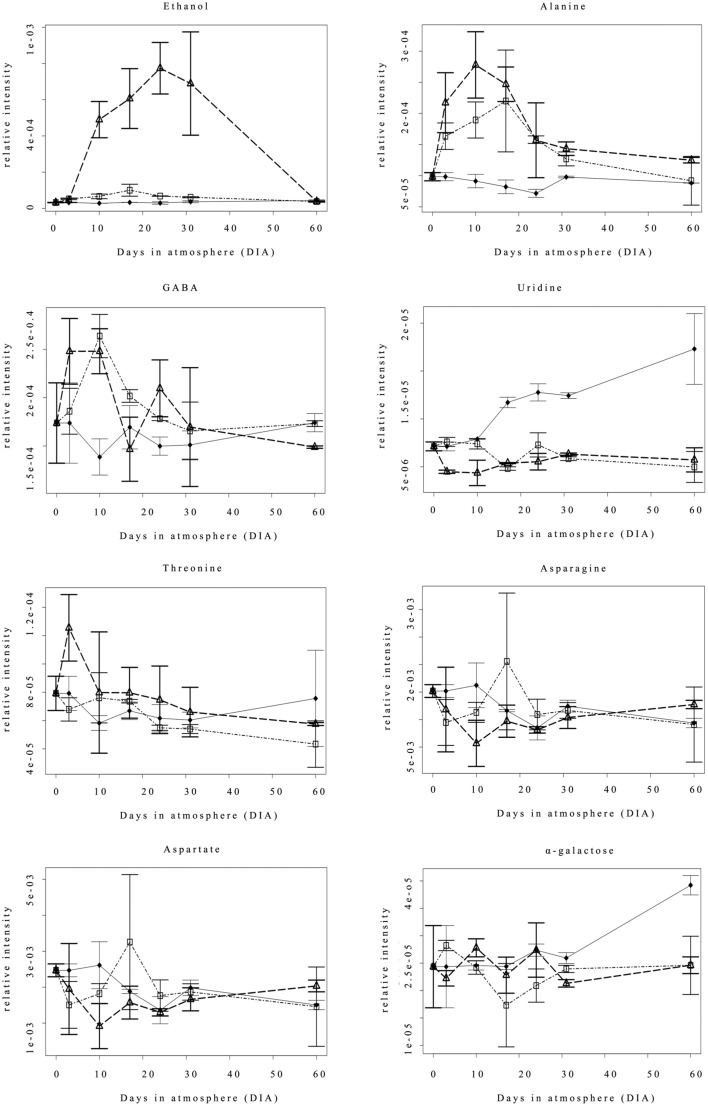
Figure 2.
Changes in the accumulation (expressed as relative intensity) of 8 metabolites detected by NMR analysis throughout the experimental period. Each point represents the median value of three analyses; bars indicate the Median Absolute Deviation (MAD). ♦ = Nox; Δ = 0.4ox; □ = 0.8ox. For the 0.4ox sample 31 DIA corresponds to 1 day after the shift from 0.4 to 0.8 kPa oxygen.

