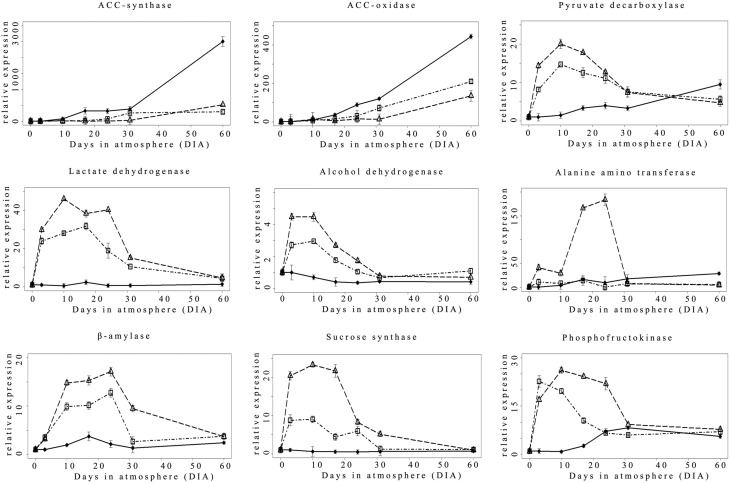
Figure 3.
Relative (T0 value = 1) expression pattern of selected hypoxia-responsive genes ♦ = Nox; Δ = 0.4ox; □ = 0.8ox. Data are means of three biological replicates. Error bars represent 95% confidence intervals. For the 0.4ox sample 31 DIA corresponds to 1 day after the shift from 0.4 to 0.8 kPa oxygen.

