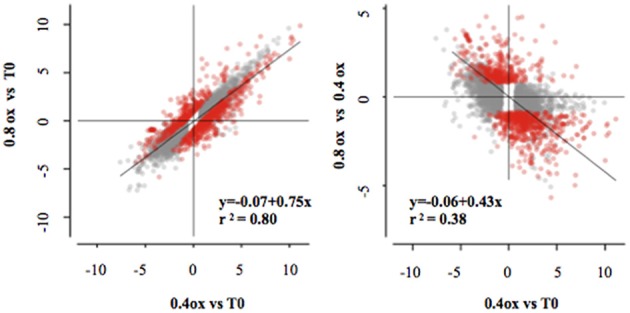
Figure 5.

Scatterplot of the log2 FCs from all identified differentially expressed genes in all comparisons (Qval < 0.001). Red dots are genes differentially expressed between the 0.8ox and 0.4ox samples (Qval < 0.001). Linear regression is based on all DEGs (left panel) and the DEGs between 0.4ox and 0.8ox samples (right panel).
