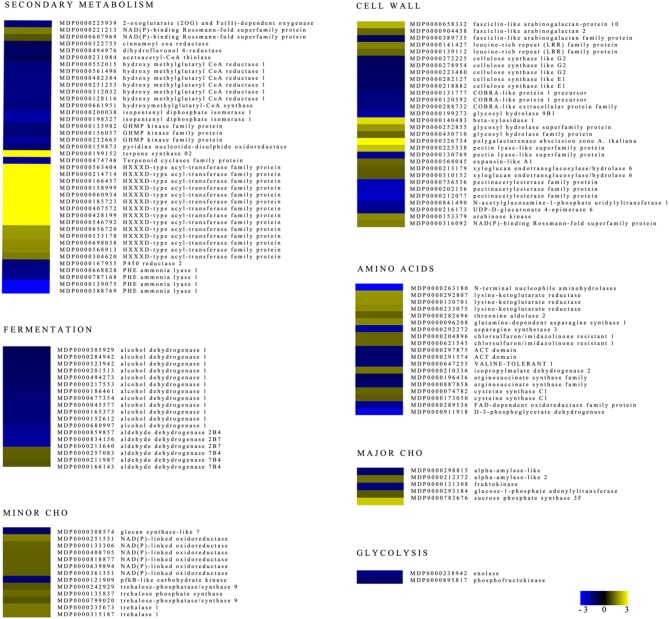
Figure 6.
Heat maps of differentially expressed genes involved in secondary metabolism, cell wall, fermentation, glycolysis, amino acid metabolism, minor and major CHO. Negative and positive values indicate those genes that showed higher expression in B (0.4ox) or C (0.8ox) samples after 24 DIA, respectively.

