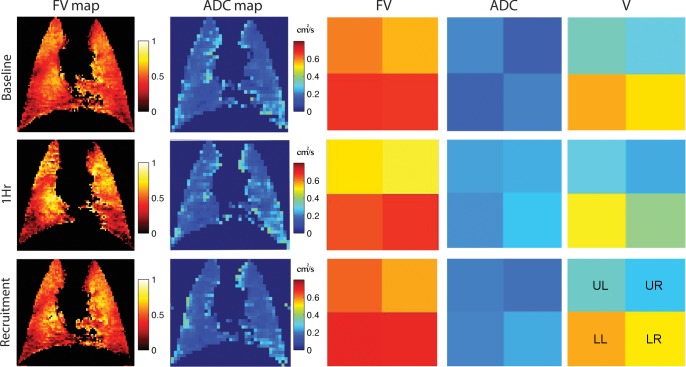
Fig. 2.
Left: coregistered maps of regional FV and ADC for 3He in the ventral slice of a representative animal. Right: mean values of FV and ADC in four regions of interest (ROI): upper left (UL), upper right (UR), lower left (LL), and lower right (LR). Gas volume (V) of each ROI (calculated from 3He density maps) is also shown. Both FV and ADC increased, whereas V decreased, in all ROIs at 1 h and returned to lower values after recruitment.

