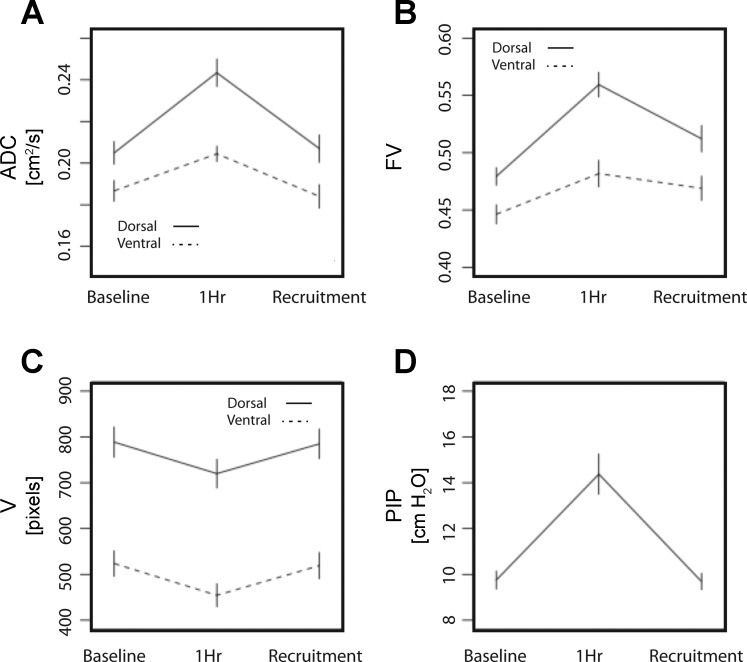
Fig. 3.
Mean values (± SD) of ADC for 3He (A); regional FV (B); inspiratory gas volume (V), quantified as pixel counts of 3He density maps (C); and peak inspiratory pressures (PIP) (D). All variables were measured in eight rats at baseline, after 1 h ventilation at zero PEEP, and after a recruitment maneuver. FV, ADC, and V were obtained from ventral (anterior) and dorsal (posterior) coronal maps. For statistical significance of MRI variables, see results of nested analysis in Table 1.

