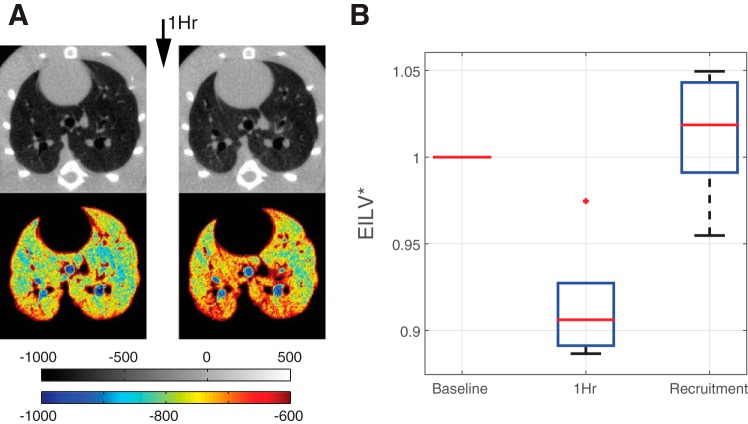
Fig. 6.
A: axial CT scans in a representative rat. B: trend in end inspiratory lung volume expressed as a fraction of baseline values (EILV*) (means ± SD of five rats) measured at baseline, after 1 h of ventilation at zero PEEP, and after recruitment maneuver. No macroscopically visible atelectasis was detected in the raw CT scans; however, a greater anterior-posterior density gradient was appreciated in the narrowed density windows (see color map beneath A) suggesting decreased aeration in the dorsal lung regions.

