
Figure 1.
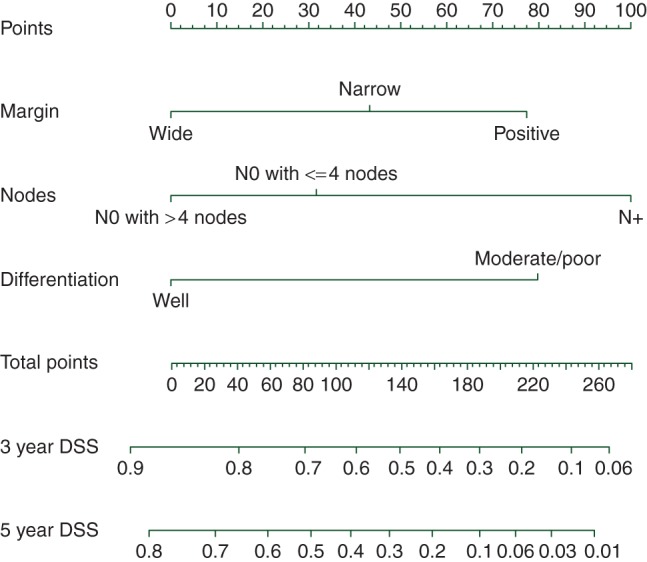
Nomogram. The predicted 3- and 5-year DSS can be read from this nomogram in two steps: (i) Draw a vertical line for each prognostic factor (margin, nodes, differentiation) from its appropriate value (e.g. for margin the values are ‘wide’, ‘narrow’, and ‘positive’) to the axis termed ‘points’ at the top of the figure. The points assigned for the value of each prognostic factor can be read where the vertical line crosses the ‘points’ axis. (ii) Add the three point scores determined at step 1 and find the sum score on the axis termed ‘total points’. Determine the predicted 3- and 5-year DSS by drawing a vertical line from the sum score on the axis termed ‘total points’ down to the 3- and 5-year DSS axes. The predicted 3-year DSS can be read where the vertical line crosses with the axis termed ‘3-year DSS’.