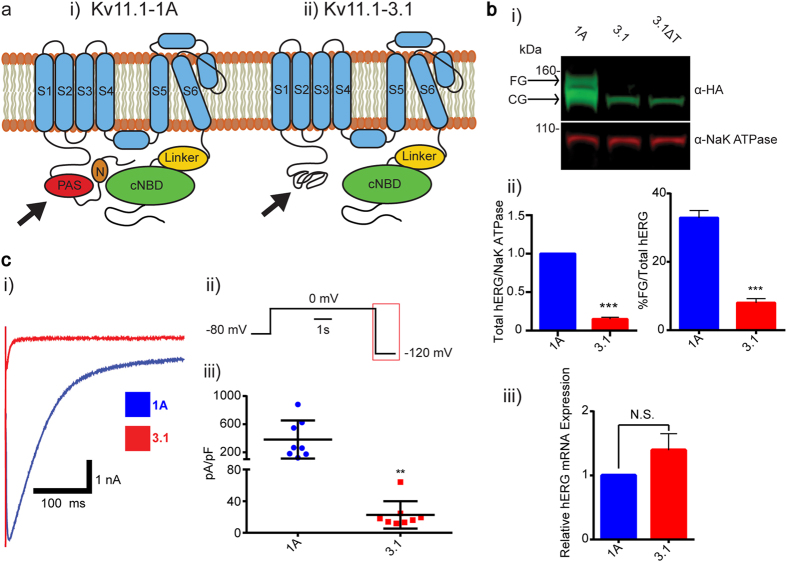
Figure 1. Kv11.1-3.1 is an N-terminally truncated hERG channel with trafficking, expression, and activity deficiencies.
(a) Illustrative examples of Kv11.1-1A (i) and Kv11.1-3.1(ii) channel structure. Full length Kv11.1 channels contain N-terminal PAS domain and amphipathic helix N-cap, suggested to interact with each other and a C-terminal cyclic nucleotide biding domain. Kv11.1-3.1, being absent of a full PAS domain, likely presents an unstably folded N-terminal motif. (b) Sample Western blot (i) of whole cell lysates from stably transfected HEK 293 cells expressing recombinant HA-tagged Kv11.1-1A, Kv11.1-3.1, or Kv11.1-3.1 after 20 hour incubation at 28 °C (ΔT). Lysates were probed with anti-HA and anti-NaK ATPase primary antibodies subsequently incubated with fluorescent IR dyes for quantitative detection. Ladder markers indicated with respective sizes in kDa. Arrows indicate respective FG and CG bands representative of mature fully glycosylated and immature core glycosylated channel populations. Neither 3.1 nor cold-incubated 3.1 show obvious FG band expression, suggesting the 3.1 trafficking phenotype is heat-insensitive. (ii) Summary quantification of trafficking efficiency (FG/Total hERG, n = 3) and relative expression differences (Total hERG/NaK ATPase normalized to 1A expression, n = 3) of 1A and 3.1 channels. 3.1 showed significant decreases in both trafficking and steady-state expression. Note that while no FG signal is visible for Kv11.1-3.1, there is a photon count present above true background. (iii) Kv11.1-3.1 expressing cells show a non-significant increase in total hERG channel transcription compared to Kv11.1-1A expressing cells via qPCR (n = 3). (c) (i) Example whole-cell deactivation tail current voltage clamp traces from HEK 293 cells expressing 1A or 3.1 channels. (ii) Currents were recorded by holding cells at −80 mV, activating channels with a voltage step to 0 mV for 5s, followed by a hyperpolarizing step to −120 mV to induce tail currents. 3.1 displays rapid deactivation compared to 1A. (iii) Peak tail currents from 1A and 3.1 traces were normalized to cell capacitance (pA/pF, n = 8) and analyzed. 3.1 shows significantly reduce average peak tail current relative to 1A. All bar graph data presented as mean ± SEM (*P = <0.05, **P = <0.01, ***P = <0.001, ****P = <0.0001).

