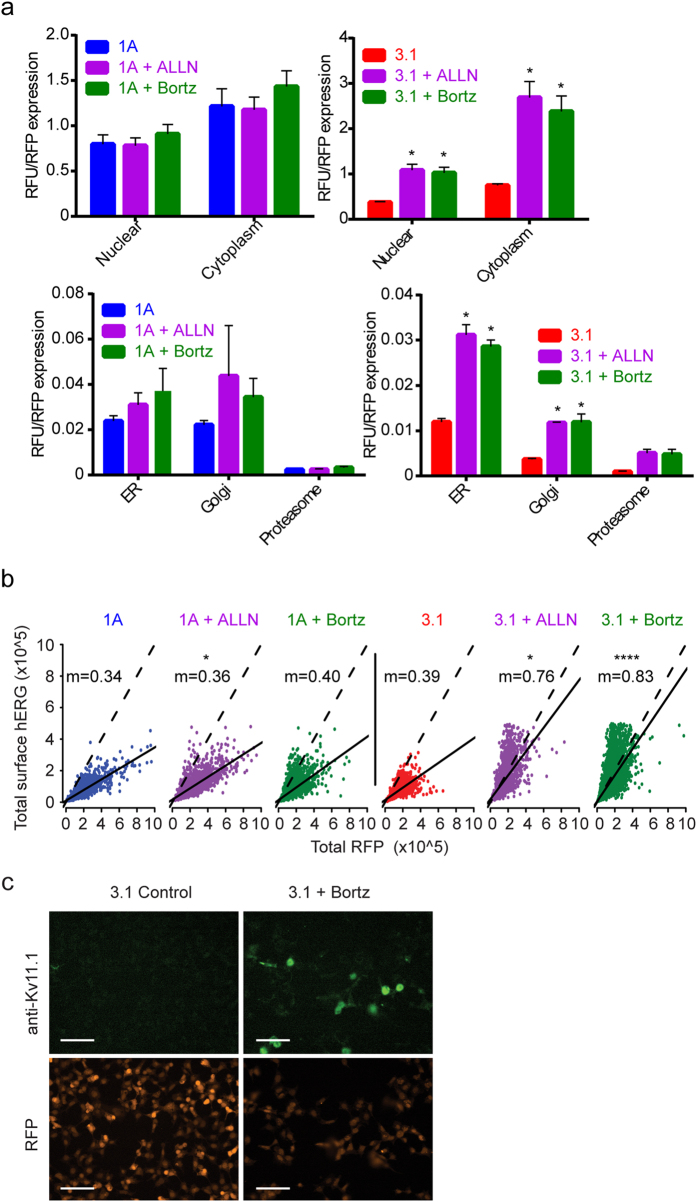
Figure 5. Proteasome inhibitor treated cells show Kv11.1-3.1 rescue across sub-cellular compartments and cell surface.
(a) RFP-normalized fluorescence of Kv11.1 1A and 3.1. Note the differential elevation of 3.1 compared to 1A after the same treatments (n = 3). (b) Scatter plot of RFP vs surface Kv11.1 in single cells, n > 3000 measurements per condition (n = 3 unique experiments). m = slope of the linear regression (solid line). The dotted lines have slope m = 1 for reference. (c) Immunofluorescence micrographs of representative fields showing specific surface Kv11.1-3.1. Scale bars = 100 μm. All bar graph data presented as mean ± SEM (*P = <0.05, ****P = <0.0001).

