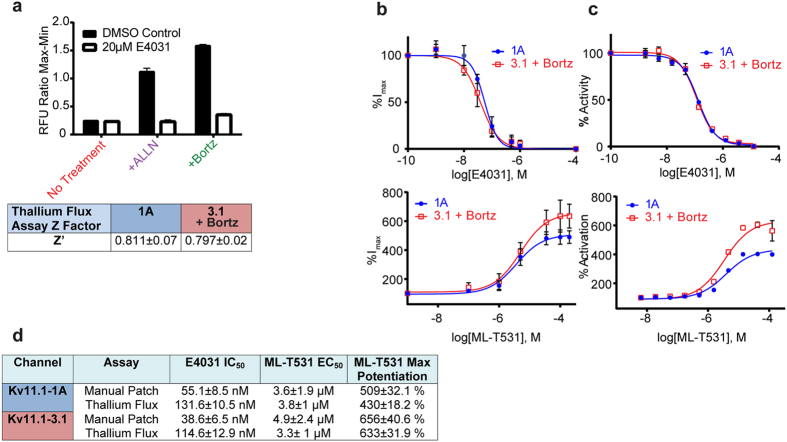
Figure 7. Bortezomib treatment of Kv11.1-3.1 expressing cells produces sufficient currents for dose-response analysis of hERG inhibitors and activators via whole cell voltage clamp and high throughput fluorescence methods.
(a) 3.1 expressing cells were treated with ALLN or bortezomib as before in 384 well assay plates. Plates were incubated the next day with assay loading buffer for 45 minutes, and then incubated with either E4031 or DMSO for 5 minutes prior to addition of stimulation buffer and subsequent signal detection. Comparison of pharmacologically treated 3.1 expressing cells and controls shows that both ALLN and bortezomib tremendously increase signal to background window in the thallium flux assay (n = 16). Z’ scores for the thallium flux assay with either 1A cells or 3.1 cells treated with bortezomib are well above the 0.5 threshold across multiple trials (n = 3). (b) Dose-response of peak tail currents to either E4031 (n = 4) or ML-T531 (1A n = 3, 3.1 n = 6) titration in whole-cell voltage clamp of cells expressing either 1A or 3.1 treated with bortezomib. (c) Dose-response of peak tail currents to either E4031 (n = 4) or ML-T531 (1A n = 3, 3.1 n = 6) titration in thallium flux assay of cells expressing either 1A or 3.1 treated with bortezomib. (d) Table summary of compound potencies and activator potentiation data. E4031 potencies decrease in thallium flux assay compared to voltage-clamp by less than 3 fold. ML-T531 exhibits higher max potentiation in 3.1 channels than 1A. All graph and table data presented as mean ± SEM.

