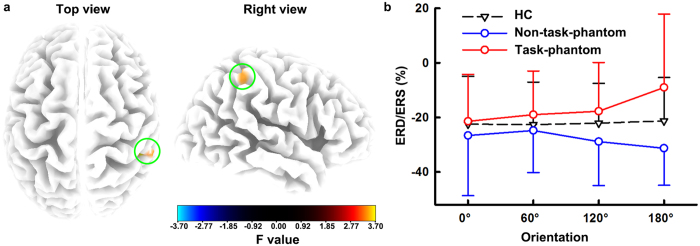
Figure 3. Source localization of the angular disparity of event-related (de)synchronization (ERD/ERS).
(a) Statistical parametric maps of the ORIENTATION × GROUP interaction for ERD/ERS of each voxel. The green circles highlight the region with significant ORIENTATION × GROUP interaction. (b) Averaged ERD/ERS of eleven voxels in the significant cluster of healthy controls (HC), amputees with a task-phantom (task-phantom) and amputees without a task-phantom (non-task-phantom) with respect to different orientations. Error bars indicate standard deviation of the mean.

