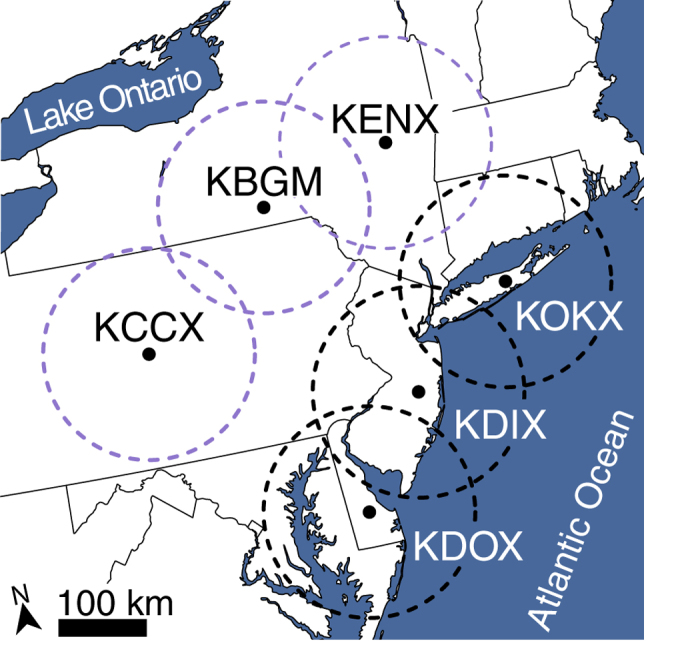
Figure 2. Radar sampling regions.

Radar locations and biological ranges (125 km) denoted by circles. Purple rings indicate inland classification and black coastal. Autumn data from 2013 and 2014 were assessed from August 6th to October 30th. Map was generated using QGIS57.
