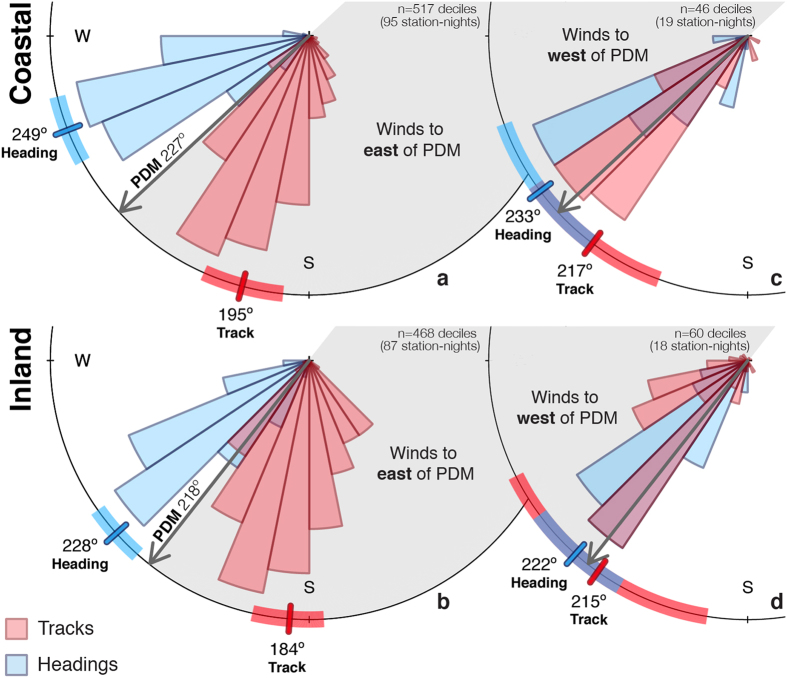
Figure 4. Heading and track distributions.
Migrating birds’ tracks and headings for winds east (a,b) and west (c,d) of the preferred direction of movement (PDM). The area of each sector is proportional to the frequency of directions in that sector, weighted by migration intensity (dBZ). Mean directions plotted as tick marks on the circle border, 95% confidence intervals shown as transparent rectangles behind tick marks. Mean heading and track directions were calculated from decile samples.

