
Figure 1. Relative abundance of blaTEM, blaSHV, blaOXA, blaCTX-M and int1 gene levels in post-1940 archived soils from fields that have only received manure (M) or inorganic fertiliser (IF) applications since 1894.
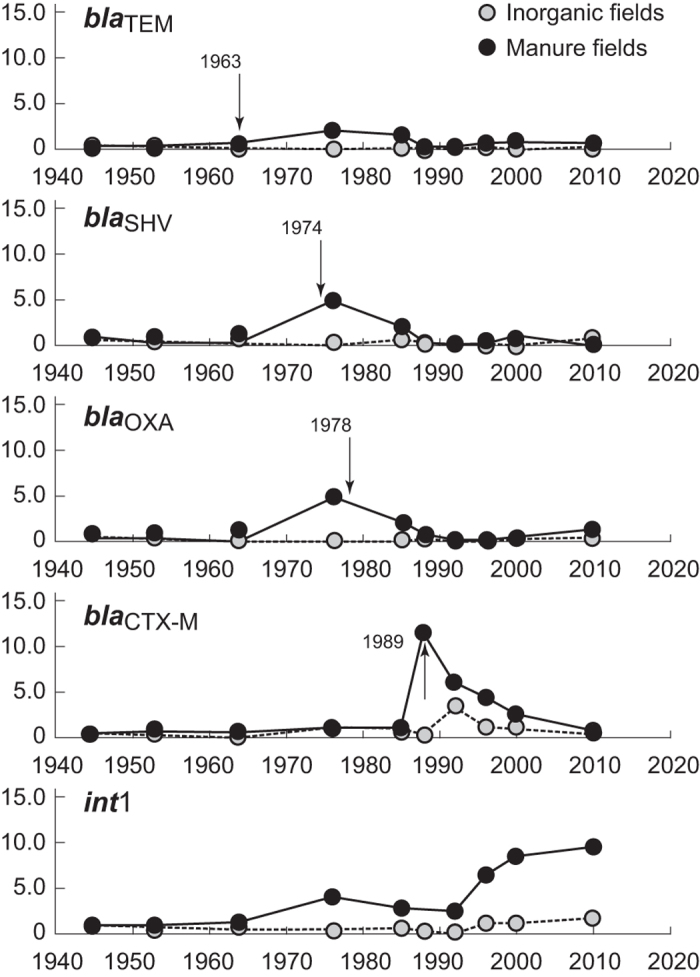
Data are reported as ratios of gene abundances (normalised to 16S-rRNA bacterial levels) in each sample relative to background levels determined from 1923 and 1938 samples. Dashed arrows correspond to dates when each gene was first reported in the literature associated with clinical isolates. Each point typically represents the mean of duplicate analyses for soil archive sample.