
Figure 2. Mean relative abundances of the sum of all four bla genes, int1, blaTEM, blaSHV, blaOXA, and blaCTX-M in post-1940 archived soils that have received continue manure (M) or inorganic fertiliser (IF) application since 1894.
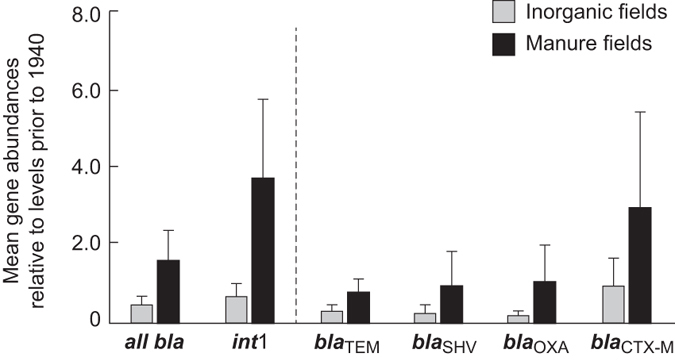
Data are mean ratios of each gene indicator (normalised to 16S-rRNA bacterial levels) in each sample relative to levels determined from 1923 and 1938 samples (n = 9 or 10). Error bars refer to 95% confidence levels in the means.