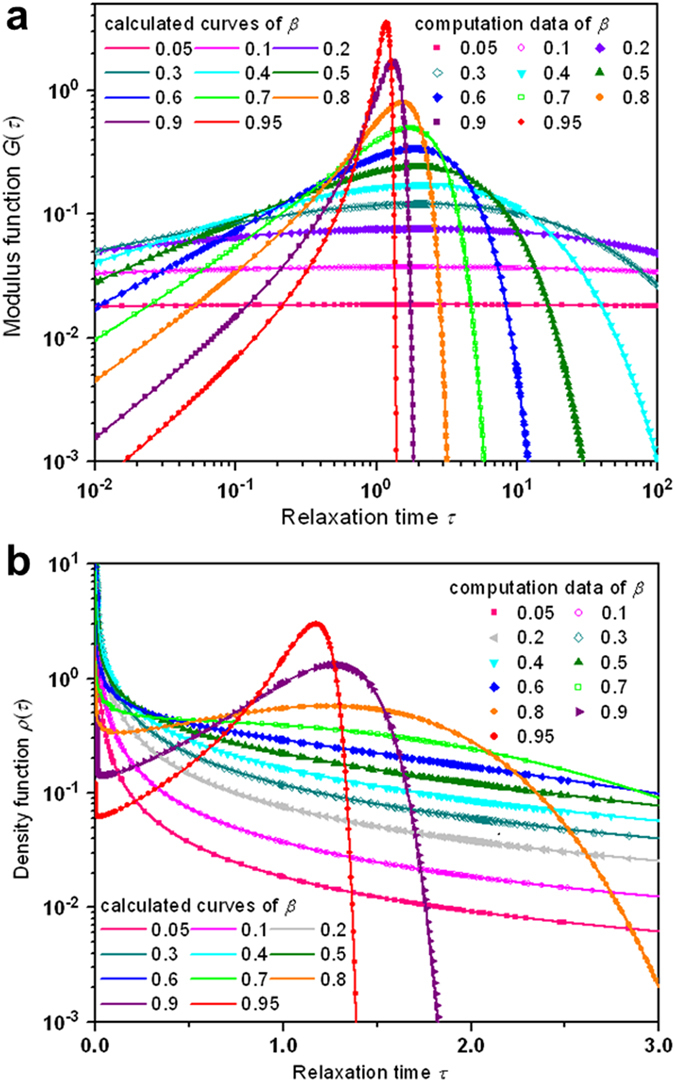
Figure 1. Analyses of the computational results of the KWW relaxation time spectra for values of the stretching parameter β between 0.05 and 0.95.

The computational data points from Eq. 3 are shown in symbols and the calculated results from Eq. 5 are given in continuous curves. a, Log-log plots of the modulus function  for
for  values between 0.05 and 0.95. The results manifest a strong dependence on
  , and for the same
  ,
,  monotonically increases to attain a peak value and then decreases. b, Semi-log plots of the probability density function
  for
for  values between 0.05 and 0.95. The outcomes reveal quite different, strong dependence on
  , which divides the
  values in two ranges split by
  = 1/2. For the same
  below 1/2,
  shows the behavior of monotonic decrease, in contrary to the observation that for the same
  above 1/2,
  gives a rapid initial decrease, then increases to attain a peak value and then decreases.
