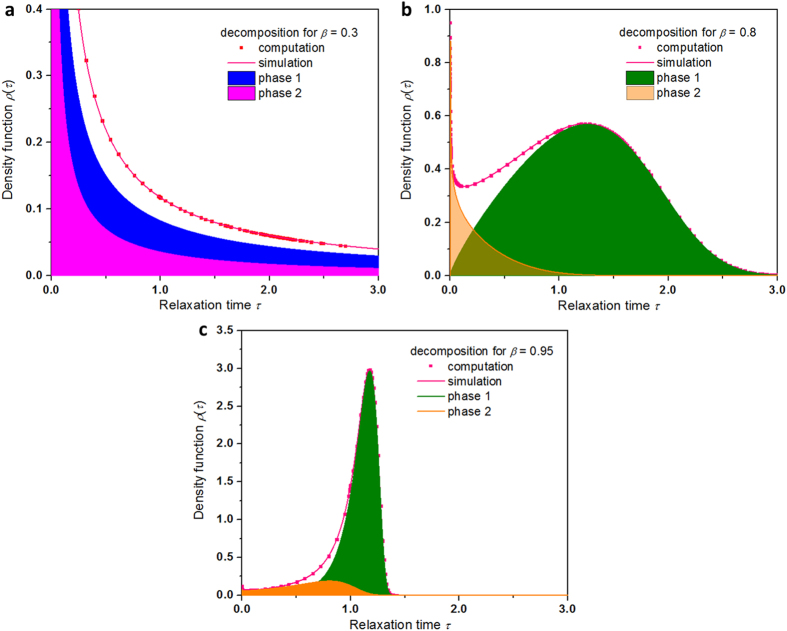
Figure 4. Decomposition analyses of heterogeneity of the probability density function  for representative values of the stretching parameter β between 0.1 and 0.95.
The probability density function  shows strong dependence on the stretched exponential
  and consists of two component distributions corresponding to two different dynamic phases. The activities of the dynamic phases are quite dissimilar for
  > 1/2 and
  < 1/2. The analyses are performed for the same
  . The signs of the symbol-lines represent the computational data points from the equation of
  (in symbol) and the calculated results based on Eq. 5 in the shadowed regions. The limiting behavior is revealed from the peaking when
  approaches 1. a,
  = 0.3. b,
  = 0.8. c,
  = 0.95. The bimodal feature is rapidly diminishing as β approaches 1, with the fast growing magnitude of the major phase against the quick weakening contribution of the minor phase, unveiling the limiting behavior of
  as
as  approaches 1.

