
Figure 1.
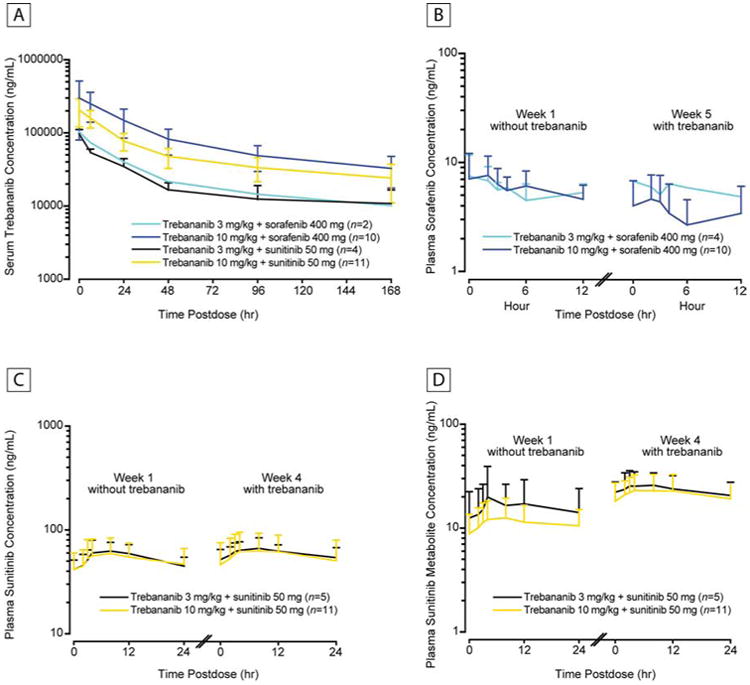
Pharmacokinetic Concentration–Time Profiles. (A) Mean (± SD) Serum Concentration–Time Profiles of Trebananib at Week 4 or 5 Following Weekly IV Infusions of Trebananib in Combination With Sorafenib or Sunitinib. (B) Mean (+ SD) Plasma Concentration–Time Profiles of Sorafenib at Week 1 Without Trebananib and at Week 5 With IV Infusions of Trebananib 3 mg/kg or 10 mg/kg. (C) Mean (+ SD) Plasma Concentration–Time Profiles of Sunitinib at Week 1 Without Trebananib and at Week 4 With IV Infusions of Trebananib 3 mg/kg or 10 mg/kg. (D) Mean (+ SD) Plasma Concentration–Time Profiles of Sunitinib Metabolite at Week 1 Without Trebananib and at Week 4 With IV Infusions of Trebananib 3 mg/kg or 10 mg/kg.
Abbreviations: SD = standard deviation.