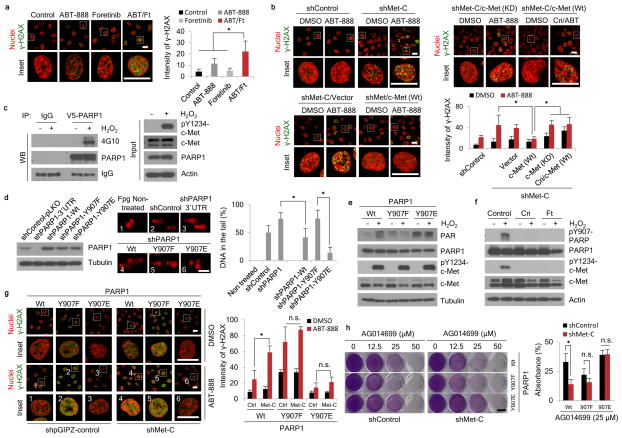
Figure 3. c-Met mediates PARP1 functions through phosphorylation of PARP1 at Y907.
(a) MDA-MB-231 cells were treated with ABT-888 (50 μM), foretinib (1 μM), or the combination for 18 h. Representative images and quantitation of γ-H2AX (green) from three independent experiments are shown. Bar, 20 μm. (b) c-Met- or control-knockdown MDA-MB-231 cells as well as c-Met-knockdown MDA-MB-231 cells re-expressing wild-type (Wt) or kinase dead (KD) mutant were treated with the indicated drugs for 18 h. Representative images and quantitation of γ-H2AX (green) from three independent experiments are shown. Bar, 20 μm. (c) HEK293T cells were transfected with V5-PARP1 and Flag-c-Met expression plasmids, and the cells were treated with 10 μM H2O2 for 15 min. PARP1 was immunoprecipitated with V5 antibody, followed by Western blotting with 4G10 (anti phosphor-tyrosine antibody). (d) Left, Western blot showing expression of PARP1 and tubulin in PARP1-knockdown (shRNA targeting 3′-UTR) MDA-MB-231 cells and PARP1-knockdown MDA-MB-231 cells re-expressing PARP1 wild-type or Y907 mutant. Center, DNA damage as measured by comet assay with pre-incubation with formanidopyrimidine DNA glycosylase (Fpg) in PARP1-wild-type-, PARP1-Y907E-, PARP1-Y907F-expressing MDA-MB-231 stable cells treated with 20 μM H2O2 for 30 min. Right, quantitation of intensity of damaged DNA from three independent experiments. Bar, 100 μm. (e) Western blot showing poly-ADP ribosylation as indicated by PAR in MDA-MB-231 stable cells described in (d) treated with or without 20 μM H2O2 for 30 min. (f) MDA-MB-231 cells were treated with or without 20 μM H2O2 for 30 min or H2O2 plus 2 μM crizotinib or 1 μM foretinib pre-treatment 1h. Cell lysates were subjected to Western blot analysis using the indicated antibodies. (g) Re-expression of wild-type or mutant PARP1 in PARP1-knockdown MDA-MB-231 cells with or without c-Met knockdown were treated with 50 μM ABT-888 for 18 h. γ-H2AX (green) was detected by immunofluorescence confocal microscopy. Bar, 20 μm. Representative images and quantitation of three independent experiments are shown. (h) Stable cells described in (g) were treated with the indicated concentrations of AG014699 and subjected to clonogenic formation assay for 8 days. Representative images and quantitation of clongenic cells from three independent experiments are shown. Bar, 10 mm. Error bars represent s.d. *P < 0.05, t-test. n.s., not significant. ABT, ABT-888; Cri, crizotinib; Ft, foretinib.

