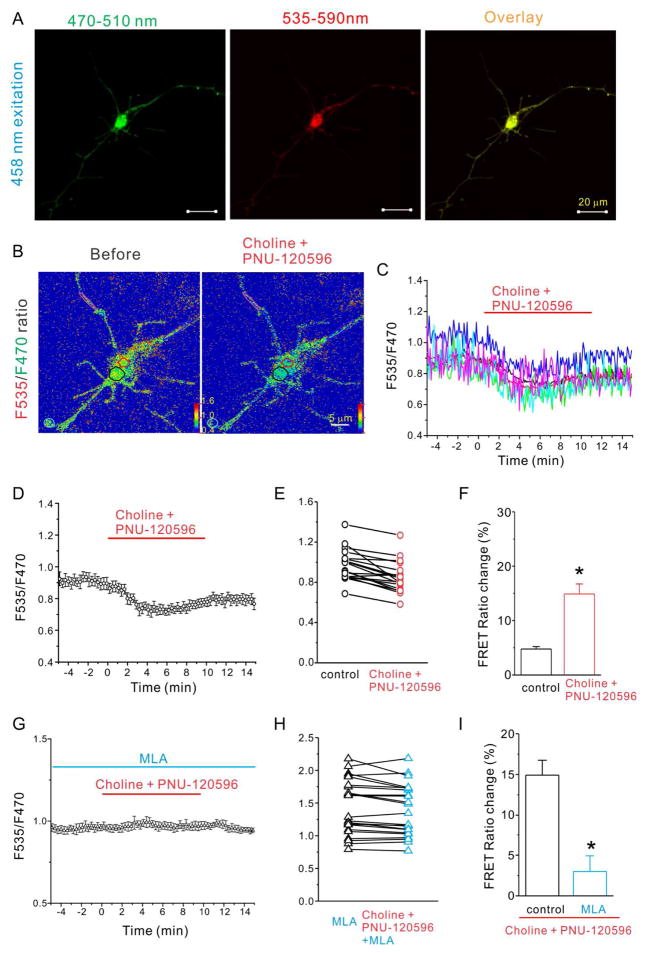
Figure 2.
Choline and PNU-120596 decreased FRET ratio in hippocampal neurons expressing cAMP sensor and α7 nAChRs is dependent on activation of α7 nAChRs. A) Fluorescent images of a representative hippocampal neuron expressing the cAMP sensor TEpacVV and α7 nAChRs excited with 458 nm laser and viewed with 470–510 nm emission spectrum (F470, left), or 535–590 nm emission spectrum (F535, middle), and overlay (right) (scale bar= 20 μm). (B) F535/F470 ratio images before (left) and during choline and PNU-120596 (right) application at 10 minute time point with color coded ROIs. FRET ratios of individual ROIs (C) and the averaged FRET ratio (D) were plotted against the time of bath application of choline (2 mM) and PNU-120596 (5 μM) (from 0 to 10 minutes). The red line indicates the duration of choline and PNU-120596 perfusion. (E) and (H) FRET ratios of tested neurons were plotted against listed conditions. (F) and (I) The histogram shows choline and PNU-120596-induced net decrease of normalized FRET ratio in listed conditions. (G) The averaged FRET ratio of a representative neuron was plotted against the time before, during and after application of choline (2 mM) and PNU-120596 (5 μM) in the presence of MLA (40 nM) Data shown are mean ± SEM; statistical significance was determined by Student’s t-test (* denotes p<0.05).

