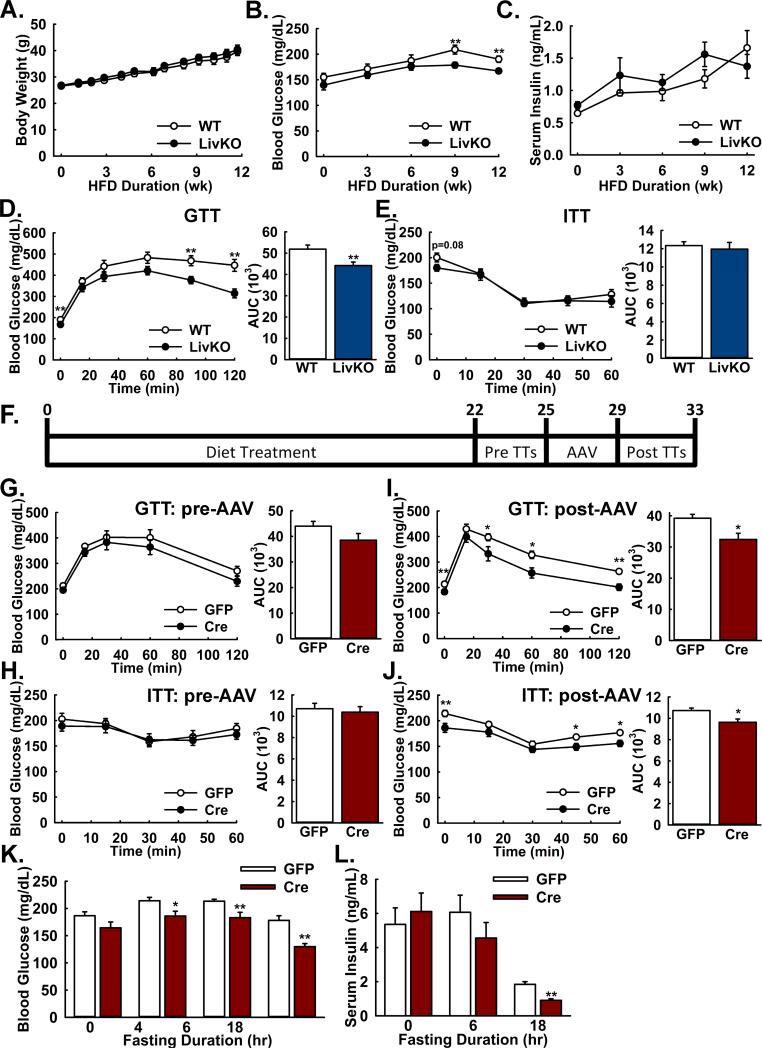
Figure 5. Both constitutive and acute Mpc1 deletion attenuate hyperglycemia and glucose intolerance during high-fat diet induced obesity.
A: Body weights of WT and Mpc1 LivKO mice over 12 weeks of high fat diet (HFD) feeding. (n=10)
B,C: Postabsorptive blood (B) glucose and (C) insulin levels of WT and Mpc1 LivKO mice over 12 weeks of HFD. (n=10)
D,E: Glucose (D) and insulin (E) tolerance tests comparing WT and Mpc1 LivKO mice after 12 weeks of HFD. Blood glucose was measured serially and an AUC calculated. (n=10)
F: Schema illustrating the time-course of high fat feeding, tolerance test (TT) administration, and AAV-GFP/Cre administration for Mpc1fl/fl mice.
G,H: Glucose (G) and insulin (H) tolerance tests comparing groups of HFD Mpc1fl/fl before treatment with either AAV-GFP or AAV-Cre. Blood glucose was measured serially and an AUC calculated. (n = 10)
I,J: Glucose (I) and insulin (J) tolerance tests comparing groups of HFD Mpc1fl/fl mice after treatment with either AAV-GFP or AAV-Cre and hepatocyte-specific Mpc1 deletion in AAV-Cre treated mice. Blood glucose was measured serially and an AUC calculated. (n = 10)
K: Blood glucose levels in AAV-GFP- and AAV-Cre-treated mice after 0, 4, 6, and 18 hours of fasting. (n=10)
L: Serum insulin levels in AAV-GFP- and AAV-Cre-treated mice after 0, 6, and 18 of fasting. (n=5-10)
Data are presented as mean ± SEM (*p<0.05, **p<0.01). Also see Figure S5.

