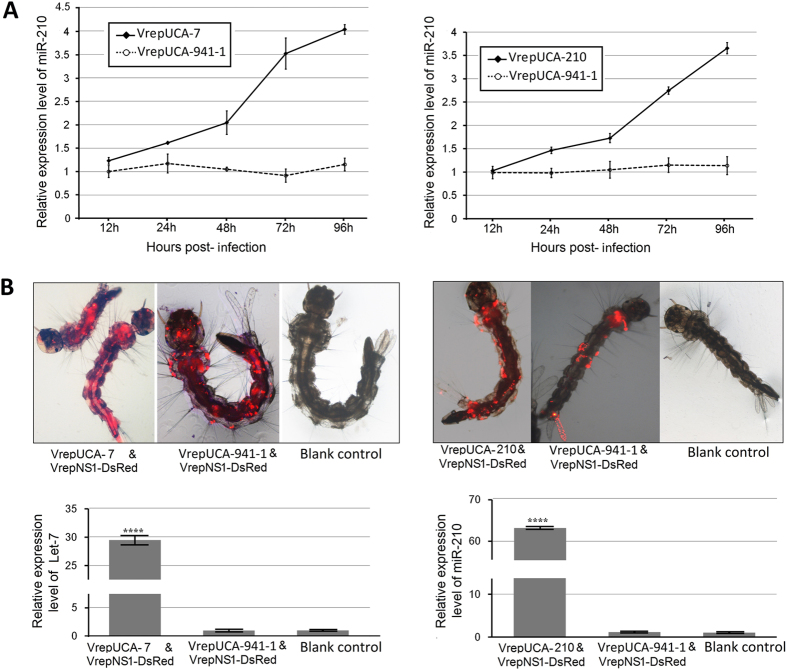
Figure 4. Recombinant MDVs-mediated endogenous miRNA overexpression in vitro and in vivo.
(A) Analysis of endogenous miRNA mRNA expression in C6/36 cells after infection with the recombinant virus. (B) The larvae with DsRed expression that were distributed throughout the body were selected for the miRNA expression level quantitative assessment (top panel). Analysis of endogenous miRNA expression in larvae post-transduced with the recombinant virus. miRNA abundance was normalized to 5S rRNA, and the data are displayed as the mean ± SD of three biological replicates where an asterisk indicates significance between infected and corresponding mock treatments. A t-test was performed at different levels of significance. The asterisks represent statistically significant differences from the control (four asterisks, p < 0.0001).

