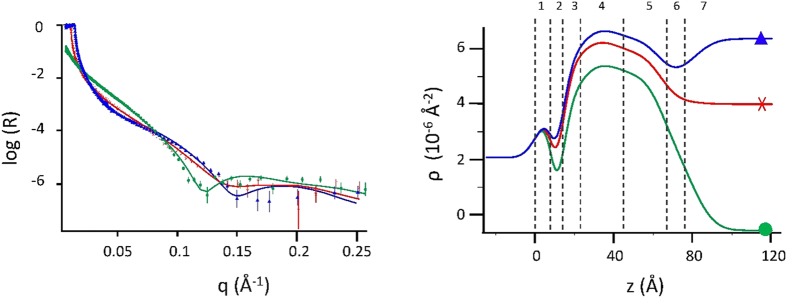
Figure 2. Multiple-contrast analysis of Membrane A at 22 °C.
Spectra (left panel) and contrast profiles (right panel) in: H2O (green dots), D2O (blue triangles) and 4 MW (red crosses). Left panel: symbols mark the experimental spectra, lines the multi-contrast combined fit. R is the normalized reflected intensity. Right panel: over contrast profiles, vertical dashed lines are drawn to guide the eye to approximately identify 7 regions, referring to different portions of the reflecting system: the silicon oxide (1), a water layer (2), the inner hydrophilic layer (3), the inner hydrophobic layer (4), the outer hydrophobic layer (5), the outer hydrophilic layer (6) and the bulk solvent (7).

