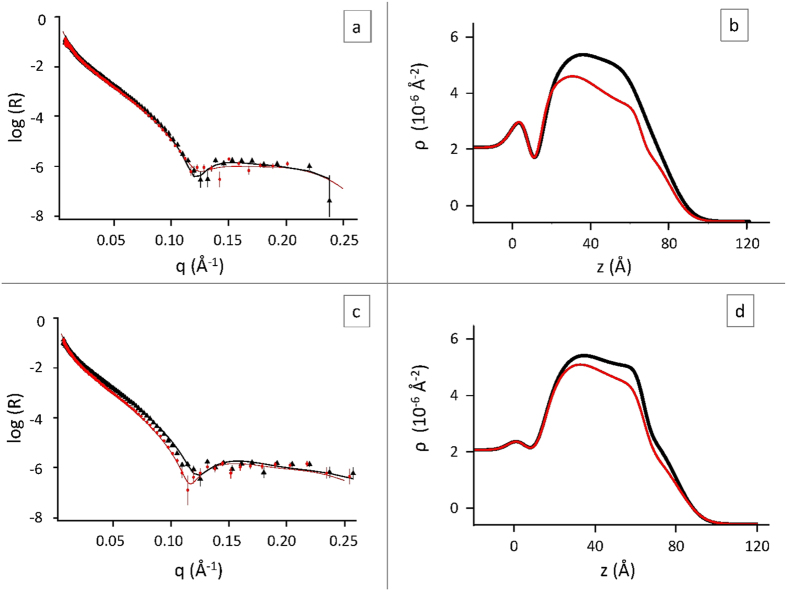
Figure 3.
Neutron reflectivity spectra of membranes A and B before (black, triangles) and after (red, dots) the interaction with Aβ1-42 structured-oligomers (panel a) and early-oligomers (panel c) respectively, in H2O at 22 °C. Lines are the best fit to the experimental data. Panel (b) and panel (d) report the contrast profiles corresponding to spectra in panel (a) and panel (c), respectively (same color code).

