
Figure 2. Acquisition of trace CRs in guinea pigs.
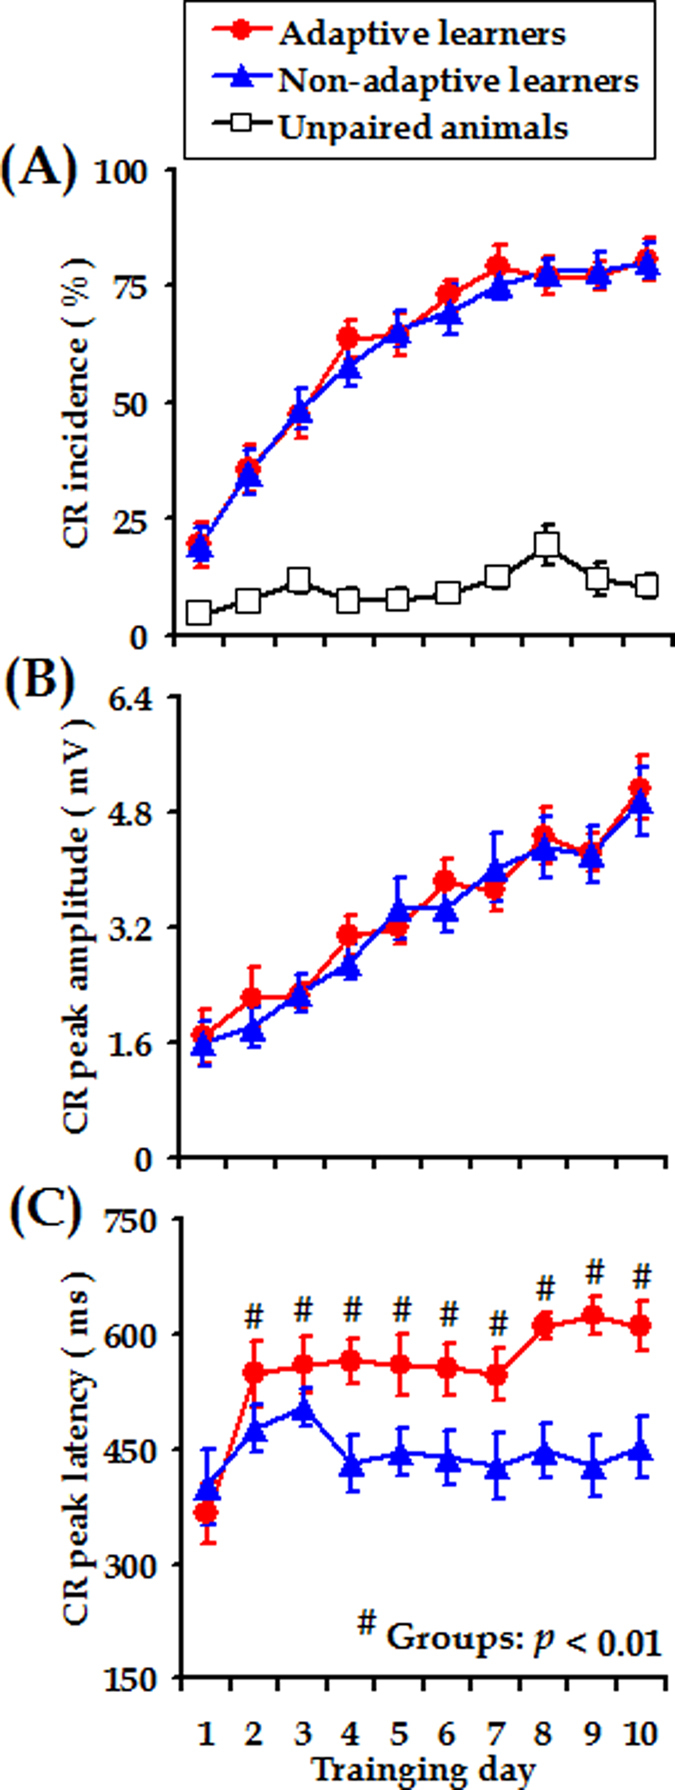
(A) Incidence, (B) Magnitude and (C) Peak latency of trace CRs measured from the adaptive learners (red circles), non-adaptive learners (blue triangles), and unpaired animals (open squares), respectively. Data are given as the mean ± SEM. Symbols are the same for (A–C).