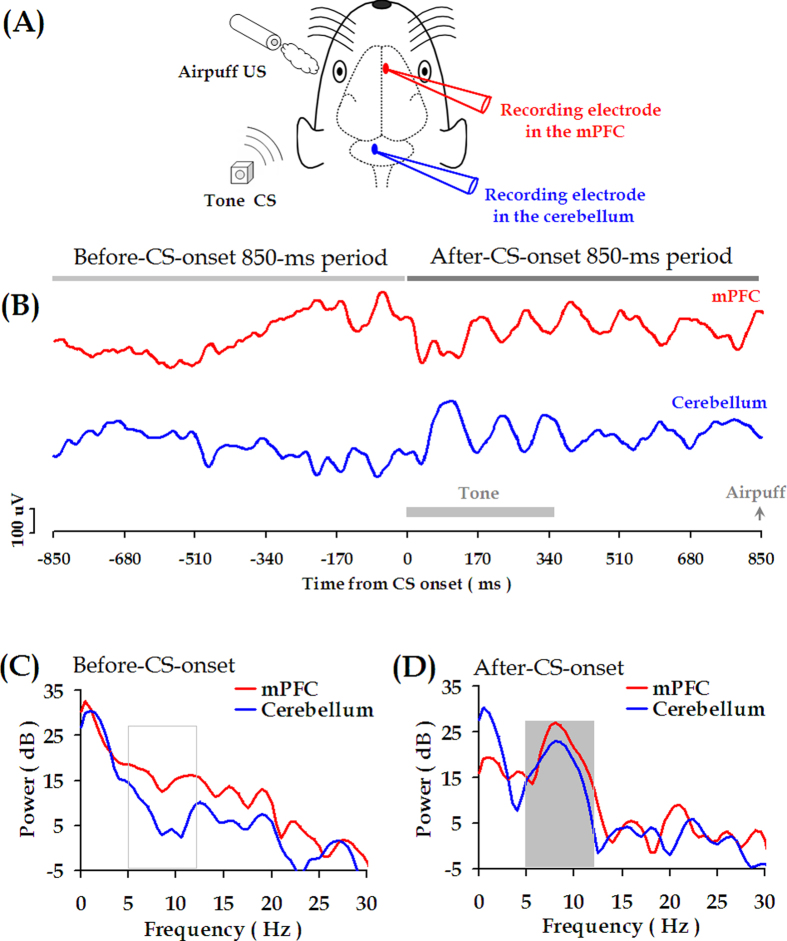
Figure 3. Theta-band oscillations (5.0–12.0 Hz) in mPFC and cerebellum.
(A) Schematic diagram of simultaneous local field potential (LFP) recording in the mPFC and the cerebellum during TEBC. (B) In a representative CS-US trial, the LFP signals are recorded from the mPFC (red trace) and the cerebellum (blue trace) during 850-ms periods before and after CS onset, respectively. (C,D) Fast Fourier transform (FFT) runs on the mPFC and cerebellar LFP signals during the 850-ms periods before and after CS onset, as shown in (B).

