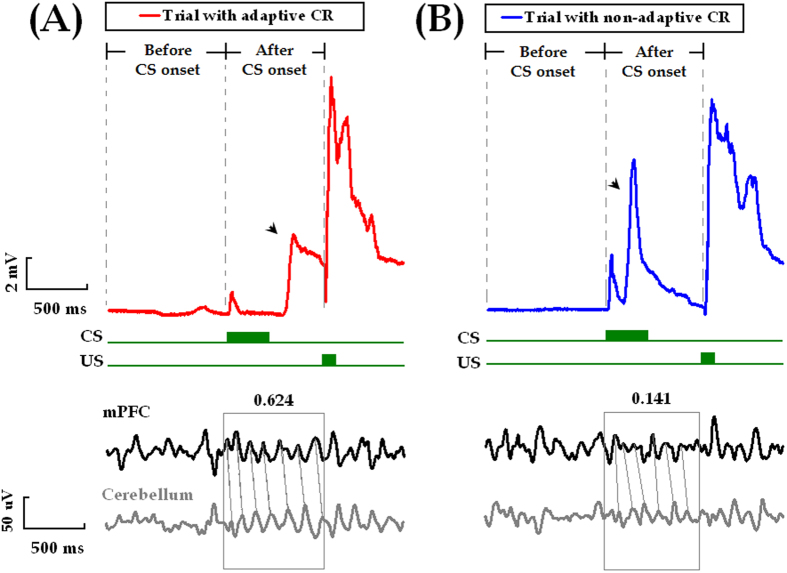
Figure 8. mPFC-cerebellum theta-band coherence was higher when adaptive CR occurred.
Representative raw LFP signals simultaneously recorded from the mPFC (black traces) and the cerebellum (gray traces) during performance of an adaptive CR (A) and a non-adaptive CR (B), respectively. Horizontal scale bar indicates 0.5 sec. Vertical scale bar indicates 2 mV for the eyelid movements and 50 μV for the LFP signals.

