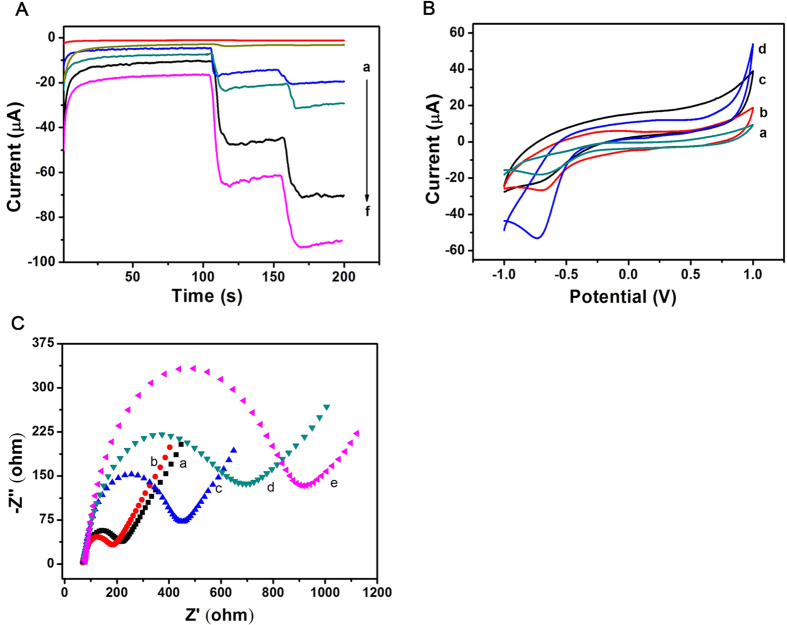
Figure 3.
(A) Ameperometic response: (a) bare GCE, (b) GO, (c) GS-Fe3O4, (d) Au@Ag NPs, (e) Au@Ag/GS-Fe3O4, (f) Au@Ag/GS-Fe3O4/Cd2+; (B) CV of the immunosensor: a bare GCE was scanned in 0.1 mg/mL of Cd2+ from −1.0 V to 1.0 V (a); using Au@Ag/GS-Fe3O4 as signal amplification platform (c); using Au@Ag/GS-Fe3O4/Cd2+ as signal amplification platform in PBS at pH = 6.8 before (b) and after (d) the addition of 5 mM H2O2; (C) Nyquist plots of the EIS method: GCE (a), Au@Ag/GS-Fe3O4/Cd2+/GCE (b), anti-IgG/Au@Ag/GS-Fe3O4/Cd2+/GCE (c), BSA/anti-IgG/Au@Ag/GS-Fe3O4/Cd2+/GCE (d), IgG/BSA/anti-IgG/Au@Ag/GS- Fe3O4/Cd2+/GCE (e).

