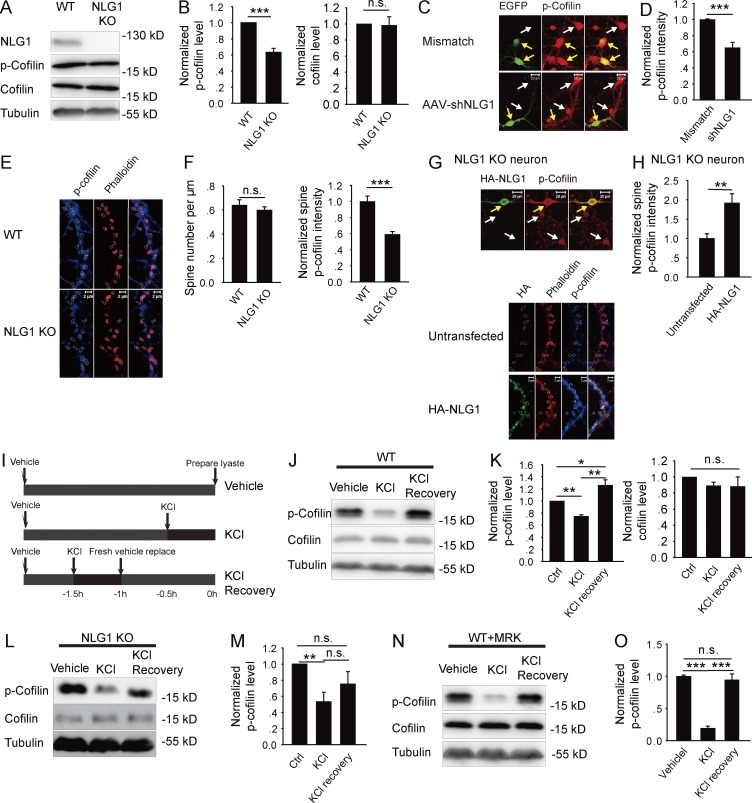
Figure 1.
NLG1 is required for cofilin phosphorylation. (A) Western blots of whole brain lysate of NLG1 KO and WT mice with indicated antibodies. (B) Summary graphs of A showing a significant reduction in p-cofilin but not total cofilin in NLG1 KO compared with WT mice. (C) Cultured hippocampal neurons infected with NLG1-shRNA or control mismatch shRNA and stained for p-cofilin. Yellow arrows indicate infected neurons (green) and white arrows indicate noninfected neurons. Note reduced p-cofilin intensity in NLG1-shRNA–infected neuron compared with noninfected neuron (bottom). No differences between mismatch shRNA-infected neurons and noninfected neurons (top). (D) Summary graph of C showing significantly reduced p-cofilin in NLG1-shRNA–treated neurons. (E) Cultured hippocampal neurons of NLG1 KO and WT costained for spine (phalloidin) and p-cofilin (circled). (F) Summary graphs of E showing significantly decreased p-cofilin in NLG1 KO compared with WT neurons, without changes in spine number. (G) Cultured hippocampal neurons of NLG1 KO transfected with HA-NLG1 and costained for spine (phalloidin, circled) and p-cofilin. Yellow arrows indicate infected neurons; white arrows indicate noninfected neurons. (H) Summary graph of G showing significantly increased p-cofilin in HA-NLG1–transfected NLG1 KO compared with untransfected neurons. (I) Schematic graph of KCl (30 mM) treatment and recovery. (J) Western blots of protein lysate of WT brain slices immediately or 1 h after KCl treatment. (K) Summary graph of J showing a transient reduction in p-cofilin immediately after KCl treatment and a sustained increase in p-cofilin after the 1-h recovery period in WT brain slices. Ctrl, control. (L) Western blots of protein lysate of NLG1 KO brain slices immediately or 1 h after KCl treatment. (M) Summary graph of L showing significantly reduced p-cofilin right after KCl treatment and no significant increase in p-cofilin after the 1-h recovery period in NLG1 KO brain slices. (N) Western blots of protein lysate of WT brain slices pretreated with MRK (10 nM) followed by the KCl treatment showing a transient decrease in p-cofilin right after the KCl treatment. (O) Summary graph of N showing a transient reduction in p-cofilin after KCl treatment, but no increase in p-cofilin above the baseline after the 1-h recovery period in the presence of MRK in WT slices. n.s., not significant. *, P < 0.05; **, P < 0.01; ***, P < 0.001.

