Figure 5.
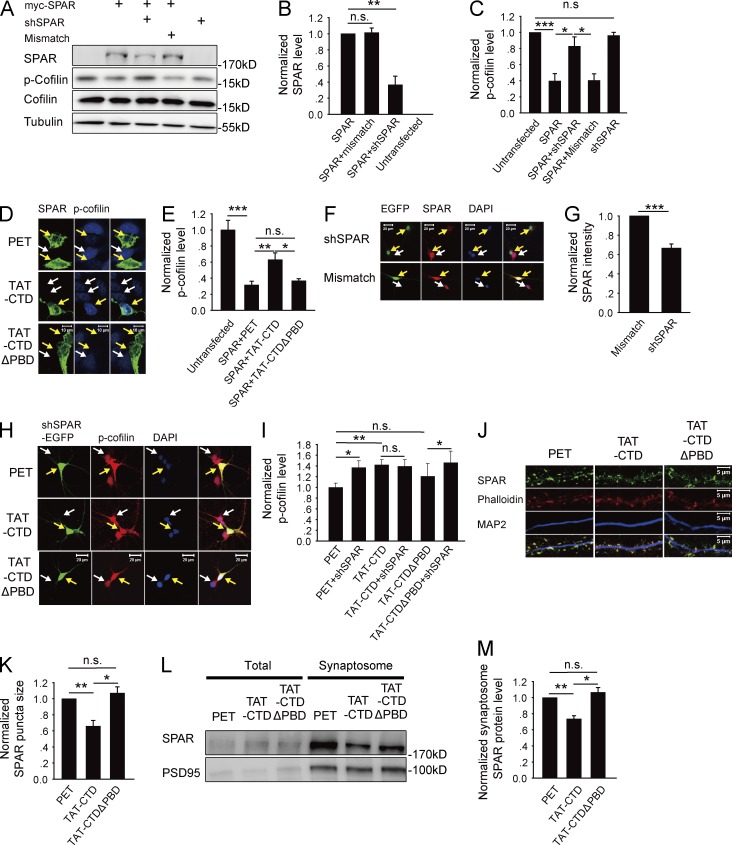
SPAR inhibits cofilin phosphorylation. (A) Western blots of protein lysate of HEK293 cells cotransfected with myc-SPAR and/or SPAR-shRNA. (B) Summary graphs of A showing reduced SPAR protein by SPAR-shRNA compared with myc-SPAR transfection alone or cotransfection with control mismatch shRNA. (C) Summary graph of A showing significantly decreased p-cofilin in myc-SPAR–transfected compared with untransfected cells. SPAR knockdown rescued the effect of myc-SPAR (i.e., increased p-cofilin). (D) Immunostaining of cultured HEK293 cells transfected with myc-SPAR (green) and treated with various recombinant proteins. Arrows indicate transfected and untransfected cells. (E) Summary graph of D showing significantly decreased p-cofilin in myc-SPAR–transfected compared with untransfected cells and that TAT-CTD, but not TAT-CTDΔPBD, or PET treatment rescued this decrease. n.s., not significant. (F) Immunostaining of cultured hippocampal neurons transfected with SPAR-shRNA or mismatch control (green). Arrows indicate neurons. (G) Summary graph of F showing significantly reduced SPAR protein in SPAR-shRNA–transfected compared with mismatch-transfected neurons. (H) Immunostaining of cultured hippocampal neurons transfected with SPAR-shRNA (green) and treated with various recombinant proteins, showing that either SPAR knockdown or TAT-CTD treatment was sufficient to increase p-cofilin. Arrows indicate transfected (green) and adjacent untransfected neurons. Note that in PET- and TAT-CTDΔPBD–treated groups, the transfected neuron has higher p-cofilin than the untransfected neuron, and in the TAT-CTD–treated group, all neurons have increased p-cofilin. (I) Summary graph of H showing that knockdown of SPAR or TAT-CTD treatment was sufficient to enhance p-cofilin. (J) Immunostaining of cultured hippocampal neurons treated with the recombinant proteins and costained for SPAR, F-actin, and microtubule-associated protein 2 (MAP2). (K) Summary graph of J showing significantly reduced spine SPAR (punctum size), but not total SPAR in TAT-CTD compared with TAT-CTDΔPBD– or PET-treated neurons. (L) Western blots of total protein lysate and synaptosomal fraction of cultured neurons treated with various recombinant proteins. (M) Summary graph of L showing significantly reduced synaptosomal SPAR by TAT-CTD but not by TAT-CTDΔPBD or PET. n.s., not significant. *, P < 0.05; **, P < 0.01; ***, P < 0.001.

